Top Charts from the Consumer Staples Sector
The Consumer Staples sector has hovered near the flat line all year, despite a big gain for the benchmark S&P 500 index. Only the Utilities have turned in a worse performance so far in 2023.
Perhaps the final quarter of the year will be a different story? October, November, and December have historically been the best months of the year to own the Staples, so they’re worth watching closely for any signs of a bounce.
If we are going to see a bounce, it’ll need to start with an improvement in breadth.
Today, nearly three-quarters of the sector’s constituents are in long-term technical downtrends, while the other quarter remain in technical uptrends. But things are deteriorating on a short-term basis, where just 1 in 10 are in short-term technical uptrends.
The sector will need to turn things around in short order if it’s to have any hope of repeating those seasonal trends.
A breadth improvement would start from pretty logical levels. Check out the ratio of the equally weighted sector compared to the market cap weighted one below (when this ratio is rising, the average stock is outperforming the sector, and vice versa). The average stock has been crushed over the last few months, bringing the ratio down to test its summer 2015 and fall 2021 lows.
Last time we were here, the ratio kicked off a year-long rally – and that rally was mirrored by the Staples’ performance relative to the S&P 500 index.
As my Uncle Steve used to say, you can’t make chicken soup from chicken poop, but you can make a chicken casserole. The Staples are losers that are guilty until proven otherwise, but a little improvement in breadth could make them short-term winners.
Digging Deeper
Poor performances from the Drug Retail (-41%) and Personal Care Products (-43%) sub-industries stand out. Those two have been especially weak since May. On the positive side, it seems our collective drinking problems are helping out the Brewers (+28%) and the Distillers and Vintners (+10%). Those two sit atop the sub-industry leaderboard.
Leaders
Lamb Weston was the best-performing stock in the sector over the last 4 weeks, rising 4.7%. That rally came at an opportune moment, when prices were backtesting the 2020 peak.
The long-term trend was damaged a bit when the stock fell below the 200-day moving average and momentum dipped deep into oversold territory, but the risk is clearly defined for LW at those former highs. We think it can sustain a rally all the way to the 161.8% retracement from the COVID collapse – especially if the sector shows some broader improvement.
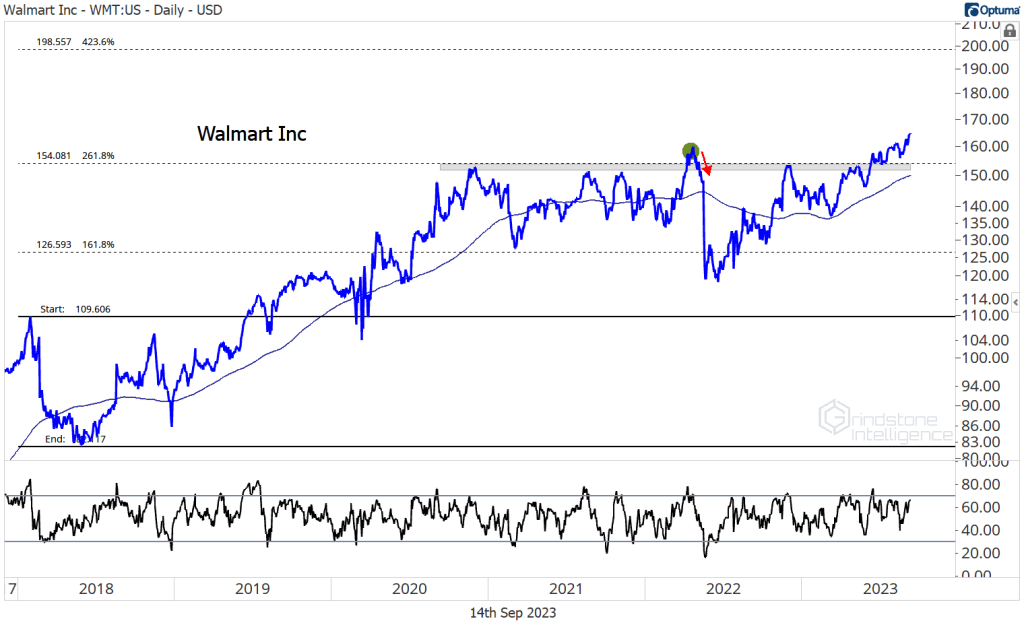
Walmart is already at new all-time highs of its own. There’s no reason not to like this one if it’s above $155, and we’ve set our sights on $200, which is the 423.6% retracement from the sharp 2018 decline.
Losers
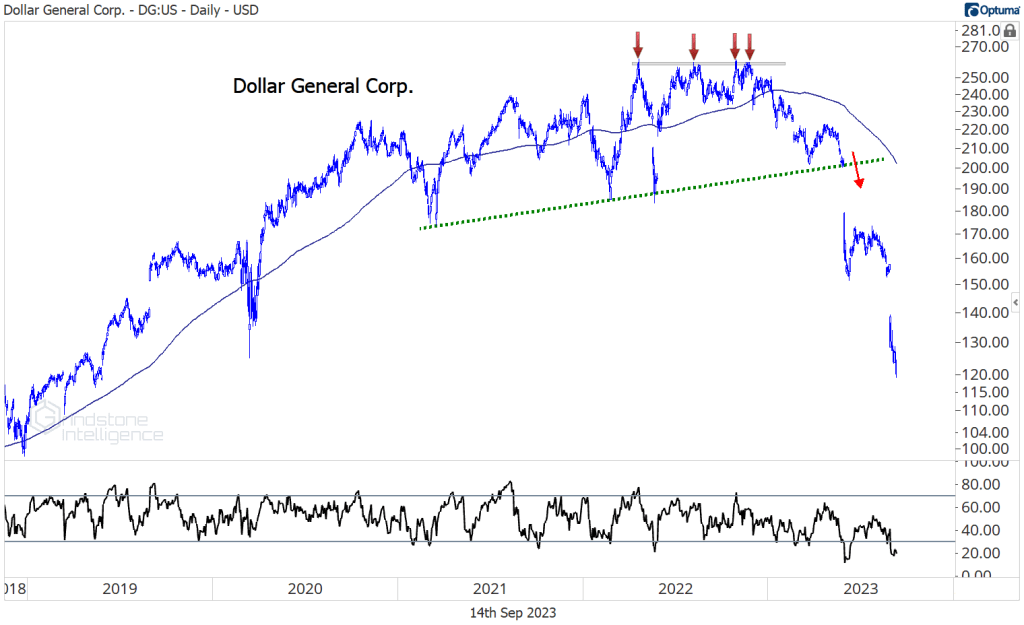
Remember how we said we needed to see an improvement in breadth? It has to start with the weakest names. They don’t even have to go up, really. They just need to stop bleeding. Dollar General dropped 27% over the last 4 weeks. It’s been but in half since hitting an all-time high just last fall.
Walgreens Boots as been just as bad. We had to zoom way out to find any potential areas of support – but find them we did. After dropping another 22% over the last month, WBA is all the way back to its 2008 lows. What better place to stop going down?
The post Top Charts from the Consumer Staples Sector first appeared on Grindstone Intelligence.


