Top Charts from the Financials Sector
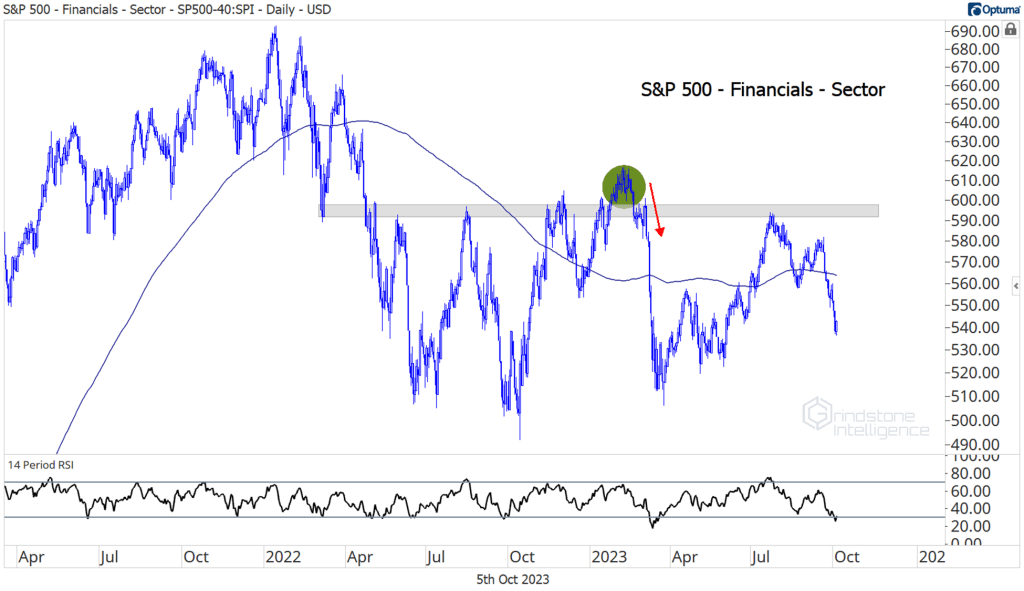
The Financials sector is stuck in no man’s land. Ever since the failed breakout in March, there’s been little reason to get excited about this group – either from the short or the long side. Instead, we’re left with prices that are messy and rangebound.
It’ll be time to get more positive if Financials can get back above 600 – the level that has caused so many issues over the last 18 months.
On the flip side, things will look very dark indeed if we break last year’s lows. Those lows didn’t occur at some random place. In fact, they couldn’t have occurred at a more important place: the 2007 highs.
If Financials are breaking below their 2007 highs, it’s a good bet that the rest of the market is falling apart, too, so we’ll be keeping a close eye. That’s not the baseline expectation we laid out earlier this week in our October outlook, but that doesn’t mean it can’t happen. Those former highs are the line in the sand.
For now, though, we’re above that level. And it looks as though Financials might be trying to string something together. Here they are on an equally weighted basis trying to break out relative to the equally weighted S&P 500.
Digging Deeper
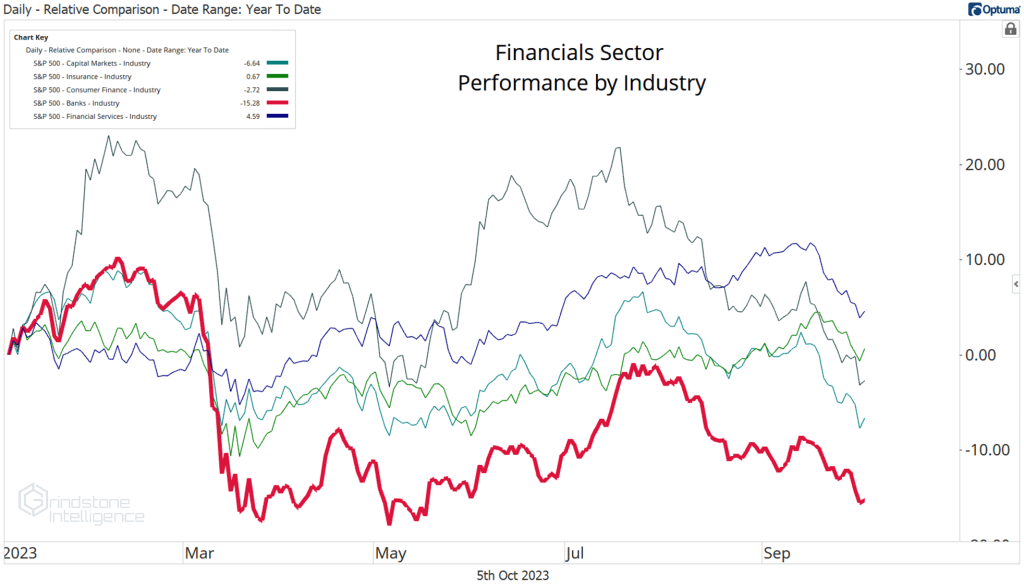
There are 5 industries in the Financials sector. Four of them are near the flatline for the year, but Banks stand out on the downside. They’ve dropped 15%, with most of the damage occurring in March.
But not all of the damage.
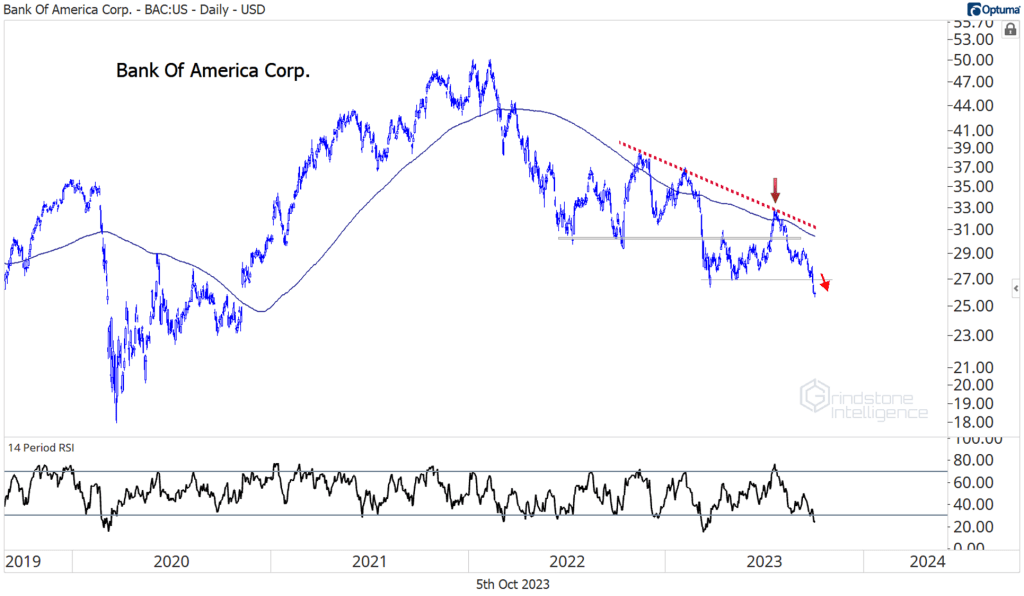
Bank of America just dropped to new 2 year lows after trying (and failing) to break the year-to-date downtrend line.
Leaders
Banks are getting hammered, but that doesn’t mean we can’t find stocks that are performing.
Cboe was the top stock over the last month after breaking out of a big, inverse head-and-shoulders continuation pattern. We’ve liked the stock above $137, with a target of $175, which is the 161.8% retracement of the 2018-2020 decline.
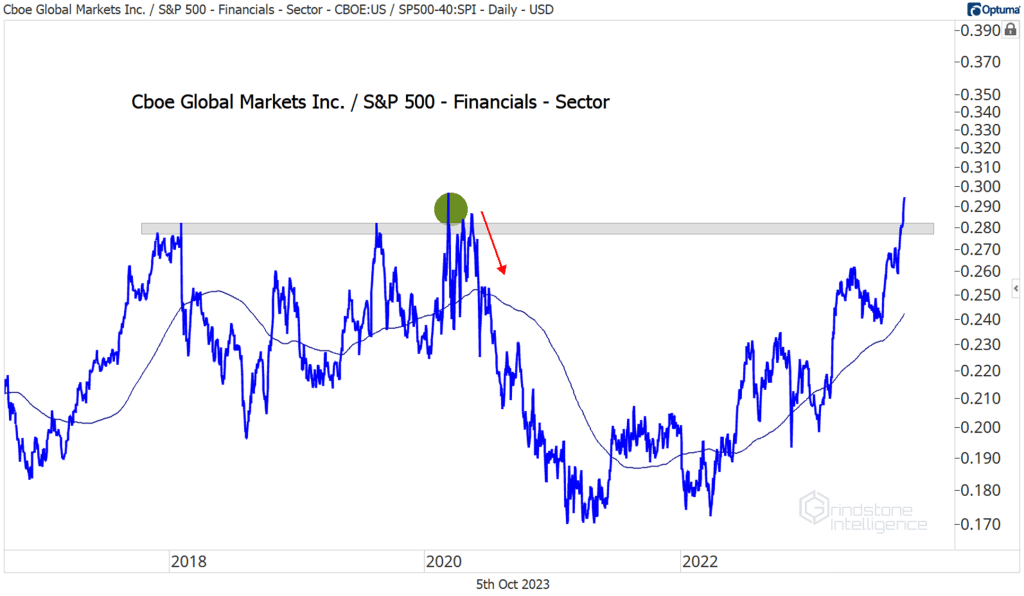
You know what else we like about Cboe? It’s showing relative strength. The stock just broke out of a 5-year range compared to the rest of the Financials sector.
Losers
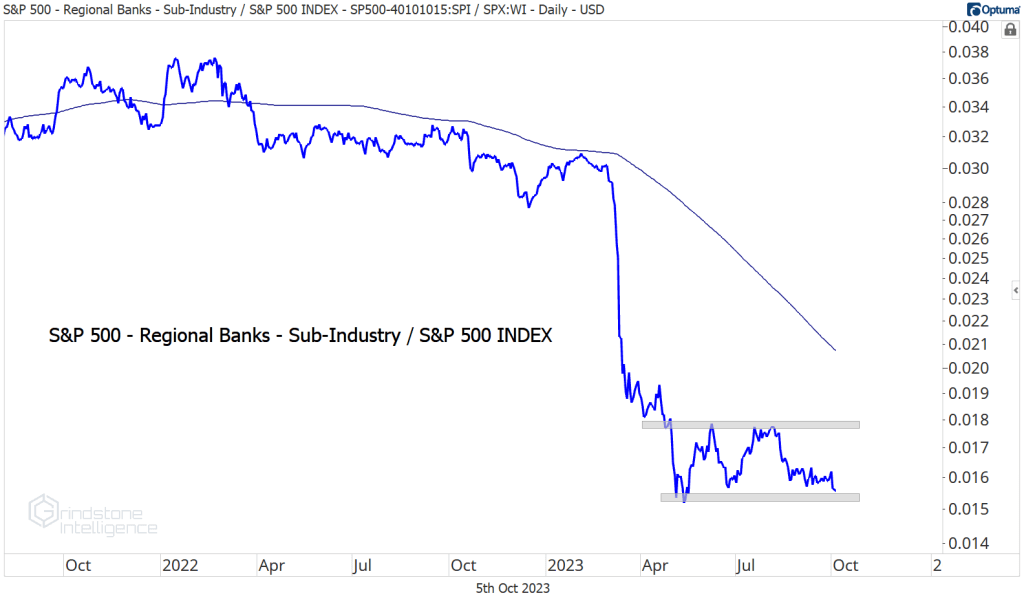
The S&P 500 index struggled in August and September, but regional banks were worse. The list of Losers is riddled with regionals, and it’s tough to see any reason that will change going forward. On a relative basis, the banks have consolidated relative to the SPX since March. But consolidations tend to resolve in the direction of the longer-term trend.
Growth Outlook
Only the Energy sector has a worse fundamental outlook than the Financials over the coming 2 years. Earnings growth is expected to average about 6% over those two years, just over half the 11% growth rate that Wall Street analysts expect for the S&P 500
The post Top Charts from the Financials Sector first appeared on Grindstone Intelligence.


