Top Charts from the Industrials Sector
Only one S&P 500 sector has reached new all-time highs this year, and it’s not home to a single ‘big tech’ stock.
The Industrials surged 11% in June, driven by a broad rally within its diverse membership.
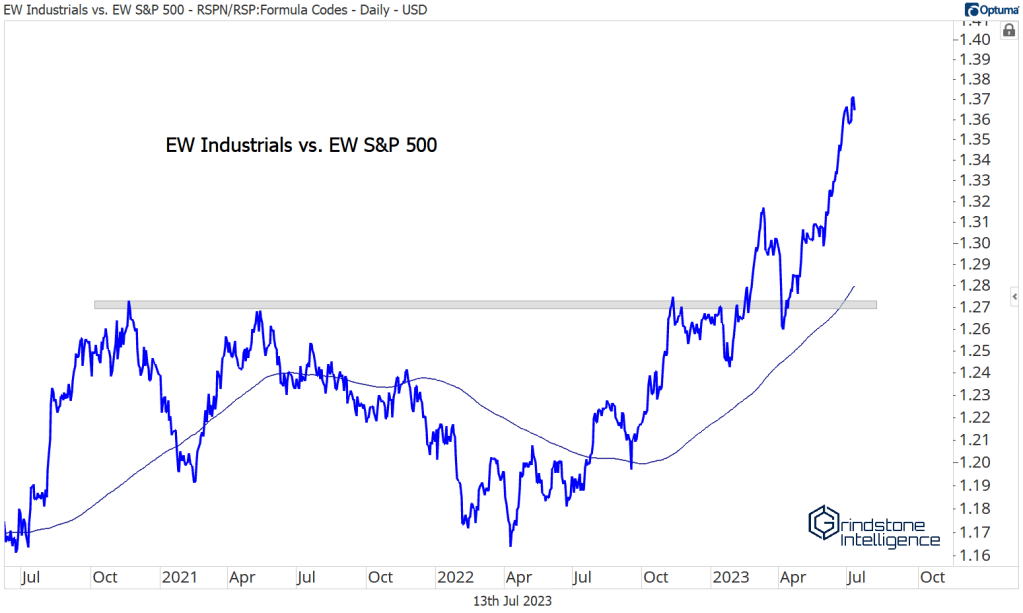
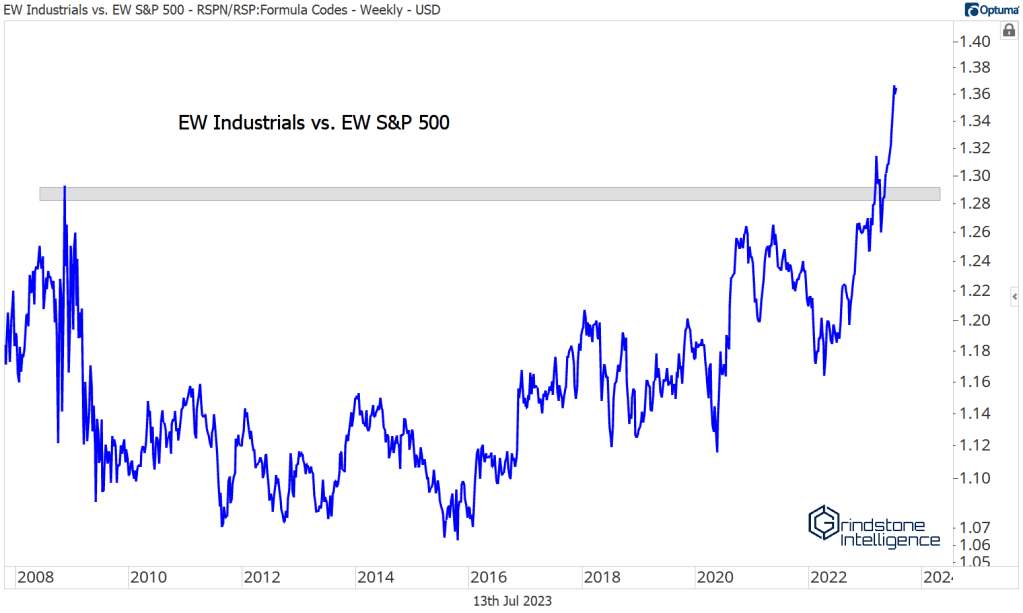
The breakout in Industrials came quickly, but it didn’t come as a surprise. We’ve been highlighting the underlying strength within the sector all year with this chart of the equally weighted sector vs. the equally weighted S&P 500. Strip out the influence of the mega caps, and the Industrials have been outperforming all year.
In fact, the ratio has never been stronger. It just moved past the 2008 all-time highs!
No sector has as many strong performers beneath the surface right now. In our last sector review, we quipped that our biggest question was which breakout stocks to leave out. Alas, we can’t own every stock that’s trending higher. What’s important, though, is that we know stocks as a group are trending higher.
Our job isn’t to decide whether or not we want to buy, but which stocks to buy.
And for us, that question is answered by relative strength. We like stocks that are trending higher and outperforming other stocks. Like Quanta Services.
Quanta just broke out of a 20+ year base relative to the S&P 500.
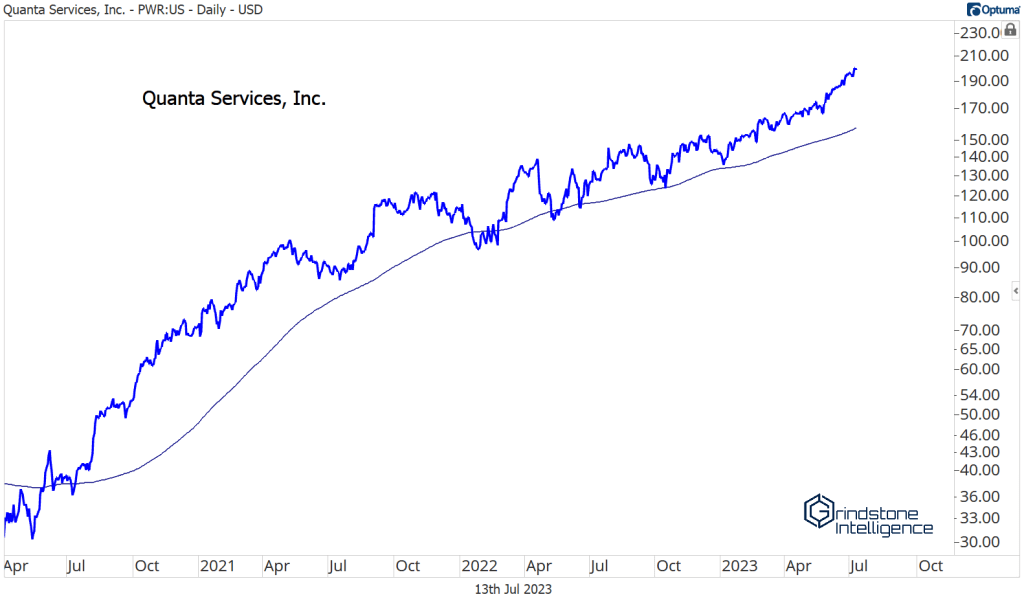
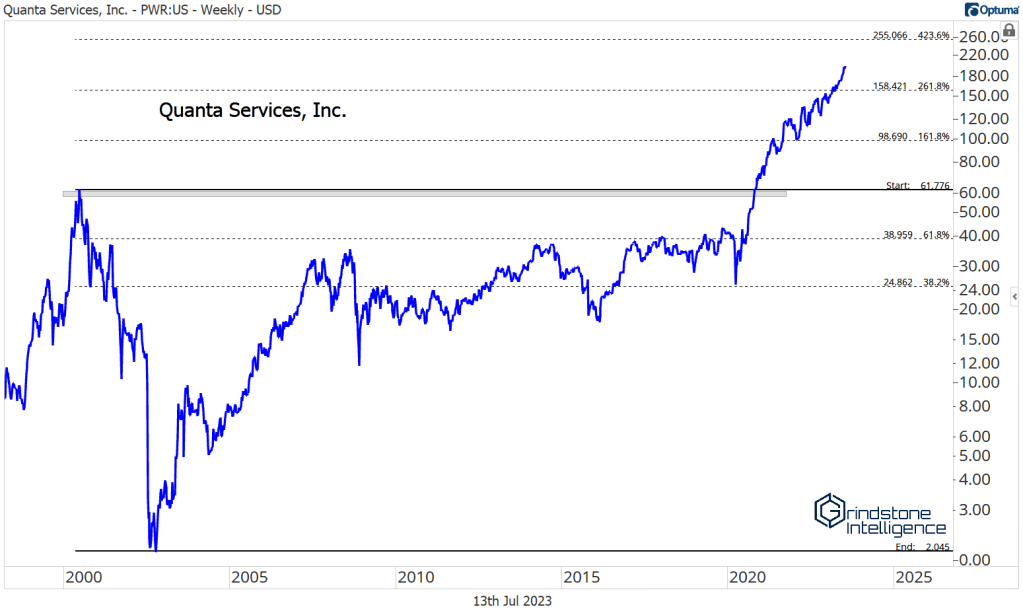
PWR has had a huge run over the last few years, rising from below $30 a share to more than $200. If you’ve been waiting for a pullback, you haven’t gotten one.
We can’t manage risk for Quanta on a short-term basis, because there aren’t any significant peaks or troughs to manage risk against! But before you say it’s gone too far, too fast, I’ll point out that the stock did nothing for twenty years! It just broke out above its 2000 highs. We blew right past the 161.8% retracement from the huge 2000-2002 selloff, and now we’re eying the next key retracement level at $255.
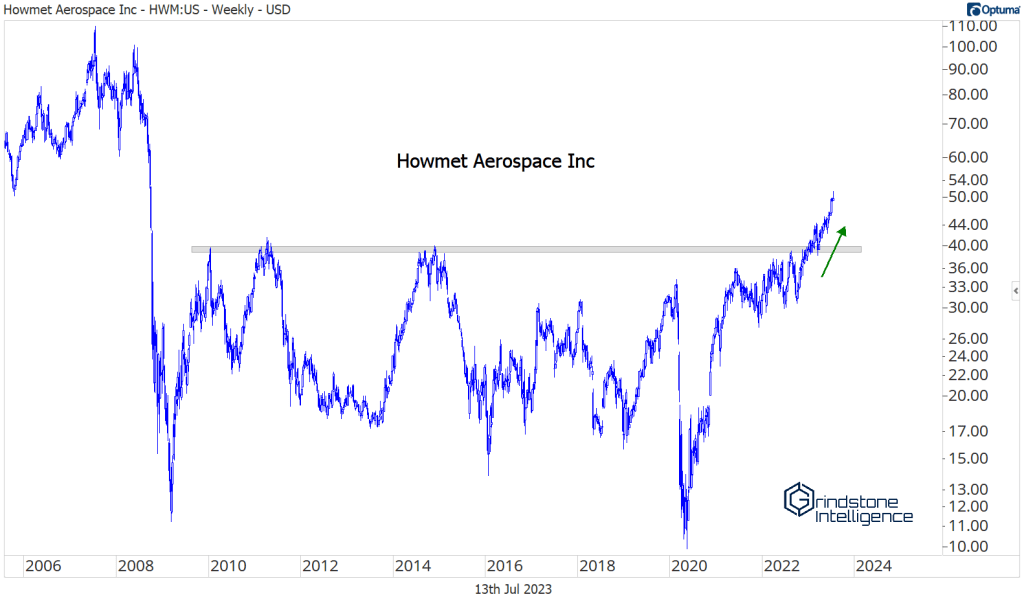
Speaking of stocks that have gone nowhere for a long time, how about the huge base for Howmet Aerospace? Our target for this one has been $70, which is the initial breakdown area from 2008.
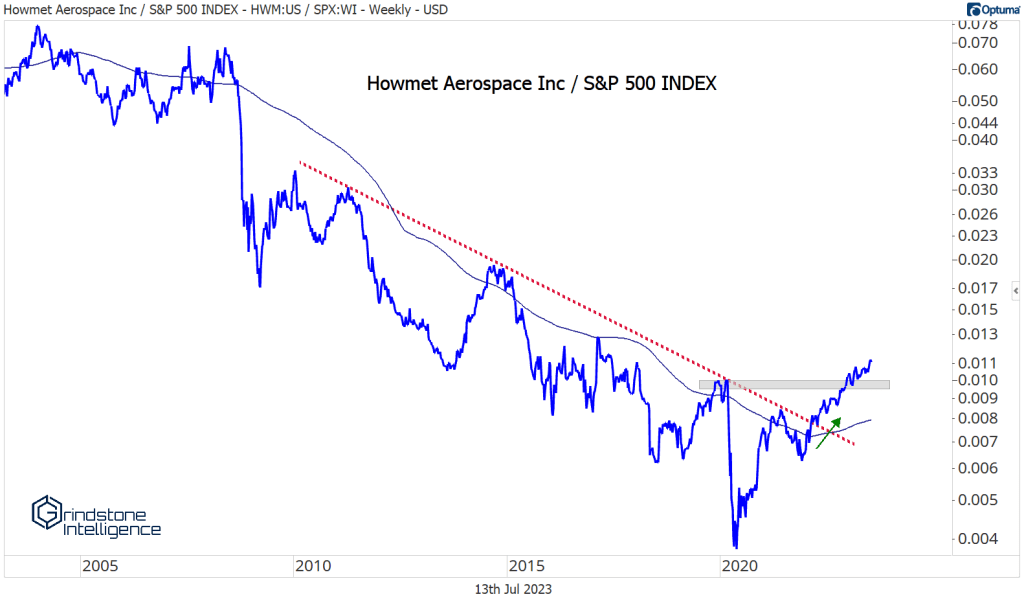
Why else is HWM on our radar? Because it’s showing relative strength. The stock is reversing a two decade downtrend relative to the S&P 500. First it cleared the 200-week moving average, then the downtrend line, and now it’s setting a higher high. That’s all the checkboxes for a new uptrend.
Sticking with aerospace, Transdigm is nearing our $930, which is the 161.8% retracement from the 2020 decline.
Longer-term, we thing TDG can go all the way to that next retracement level, above $1300. Near-term, though, that $930 level is likely to offer resistance, and it’ll do so at the same time Transdigm is reaching its former peak relative to the S&P 500. We need to see how prices respond to these levels.
In the meantime, check out GE. Have we mentioned how much we love relative strength? It’s setting multi-year highs against the S&P 500 after reversing a huge downtrend.
Midway between support and resistance, we still think GE goes all the way back to the 2017 breakdown level of $145.
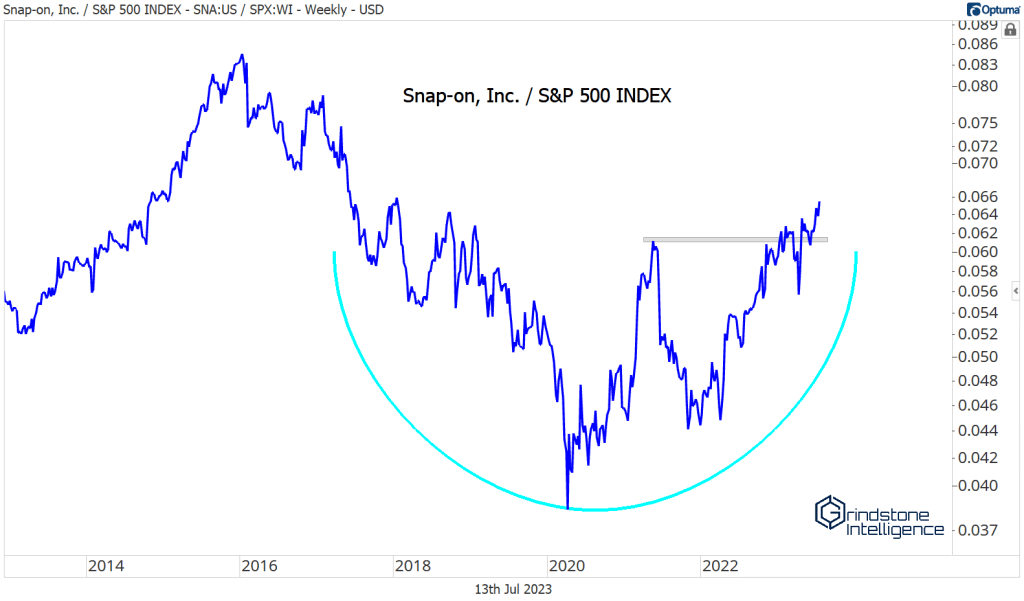
Snap-On reversed a long-term relative downtrend of its own, and just hit 6-year highs vs. the S&P 500. If you want to outperform the market, you’ve got to own the stocks that are outperforming the market.
It’s coming out of a multi-year consolidation on an absolute basis, the top end of which was the 161.8% retracement from the 2018-2020 decline. It’s surged over the last month since breaking out to new highs, and we thing it goes above $340.
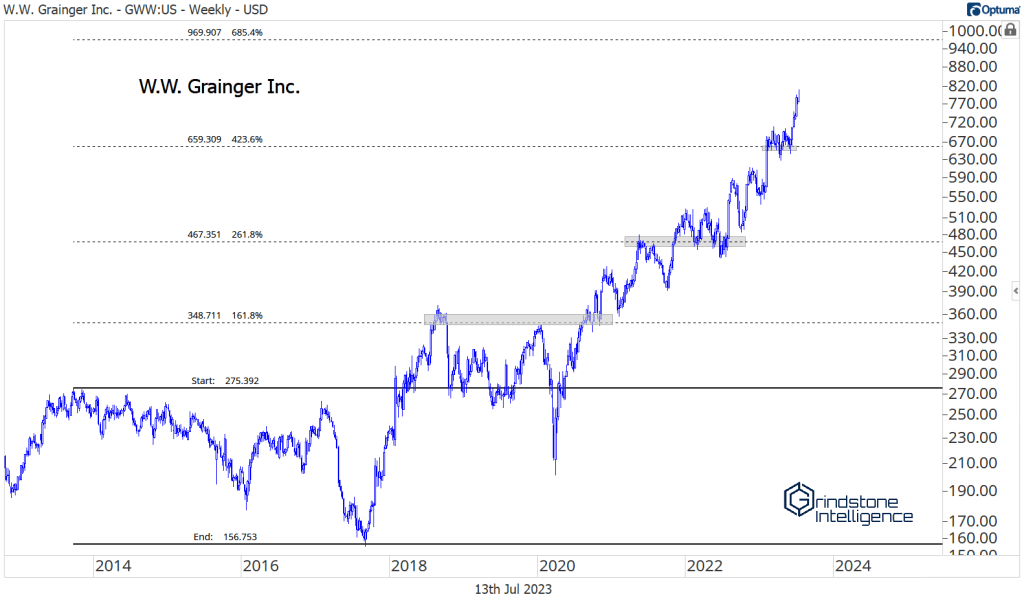
Speaking of stocks that have surged, how about the rally in Grainger? It won’t get there overnight, but we think Grainger eventually heads to $970, which is the 685.4% retracement from the 2013-2017 decline.
Backing our view is how the stock is performing against the S&P 500. It spent 10 years(!) trying to get back to the relative highs it set in 2012. It failed at those former highs last October, then pushed above them in January, and successfully backtested them in April and May. It may take a few months to digest the recent gains, but structurally, GWW is in a long-term uptrend on both a relative and an absolute basis.
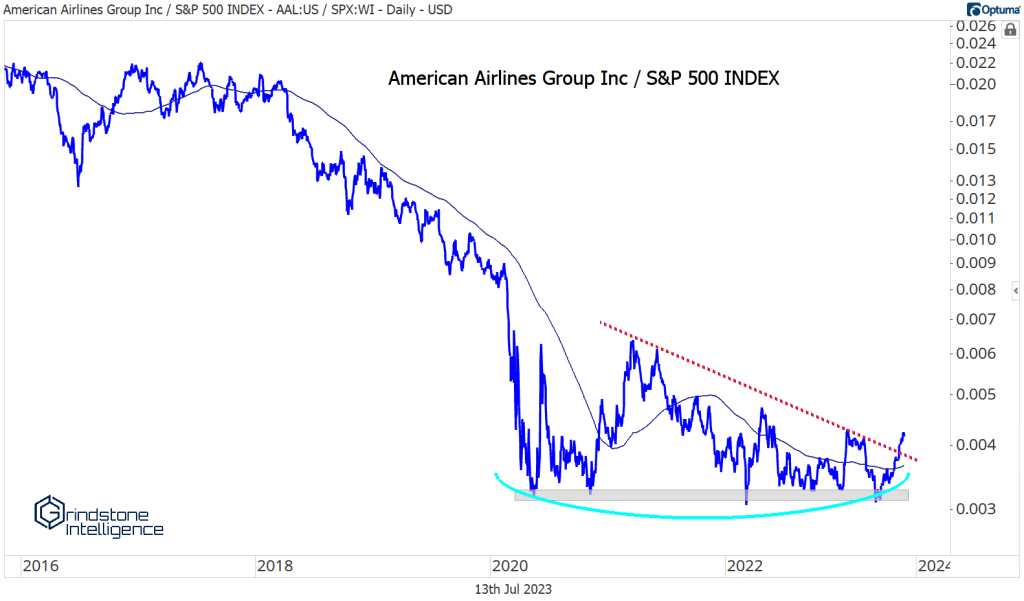
The top-performing industry of late has been the airlines. There are 3 necessary steps in reversing a downtrend: set higher lows, break the downtrend line, then set higher highs. American Airlines broke downtrends no matter how you drew them, and now it’s at new 52-week highs.
There’s still some work to do on a relative basis, but this is starting to look more like a big base than a consolidation within a downtrend. Next step? Set some new highs.
The post Top Charts from the Industrials Sector first appeared on Grindstone Intelligence.


