Chart(s) of the Week: Utilities vs. S&P 500
Ask a market analyst which sector is the most boring, and there’s a good chance they’ll tell you the Utilities. Given the mature and heavily regulated nature of their collective businesses, the group tends to be little less ‘high flying’ and a little more ‘under the radar’. Occasionally, though, Utilities garner attention for their relative stability and attractive payouts, and can outperform for extended periods.
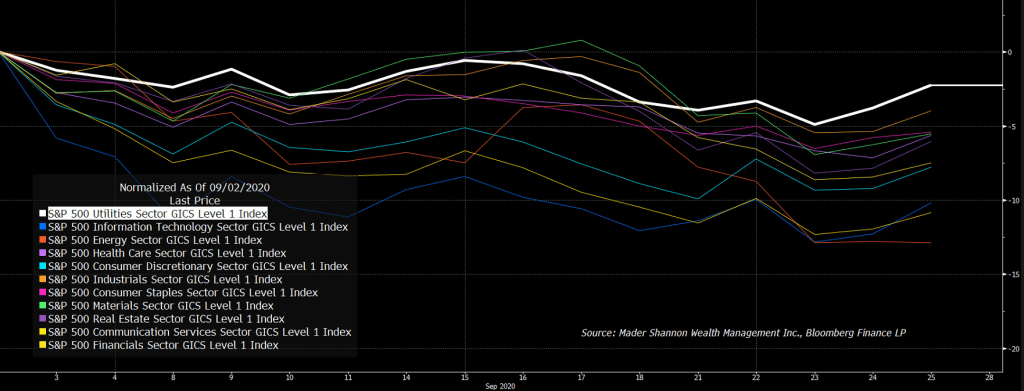
That’s been the case over the last few weeks:
The relative strength since the S&P 500 peaked on September 2, 2020 has brought Utilities back to a key level vs. the rest of the market, and how prices respond to it could have broader implications for the future of equities.
The level in question was last approached in 2018, when 4 consecutive attempts to break below it were rejected. After the sellers were finally exhausted, Utilities finished that year with a 25% relative rally, and then spent the next year stuck in a sideways channel. When the coronavirus took hold, it looked as if Utes were poised to rally again as they broke to their highest level against the S&P 500 since 2016. Growth stocks were less inclined to agree; over the next 6 months, Technology, Consumer Discretionary, and Communication Services stocks ripped to new all-time highs, while the ‘boring’ Utilities were left in the dust. Relative to the S&P 500, Utes cruised right through their 2018 lows. But thanks to the September reversal, Utilities have recovered.
So is this a false breakdown, destined to be the mirror image of March’s failed rally? Are Utilities set to lead for the coming months? If they continue to rip higher relative to the rest of the market, it’s most likely happening in an environment where risk continues to come off of the table, and stocks as an asset class are falling.
Or is this nothing more than a backtest that confirms resistance at the 2018 lows? A rejection here could be an all-clear signal, indicating that the rally in growth stocks is back on.
Nothing in this post or on this site is intended as a recommendation or an offer to buy or sell securities. Posts on Means to a Trend are meant for informational and entertainment purposes only. I or my affiliates may hold positions in securities mentioned in posts. Please see my Disclosure page for more information.
The post Chart(s) of the Week: Utilities vs. S&P 500 first appeared on Grindstone Intelligence.


