Checking in on Commodities
What do we want to own?
That’s the question we ask ourselves every day. Is it stocks? Bonds? Commodities? Crypto? Cash? Whether you’re an investor, money manager, or day trader, we all face a similar problem in bull markets: limited capacity. We can’t own every uptrend and compelling story. Instead of just focusing on the good, we have to focus on the best.
That’s where relative strength comes in handy. The only thing that all securities have in common is price, and price is easy to compare. All we have to is take the price of one asset divided by the price of another, and we can see which one is doing better.
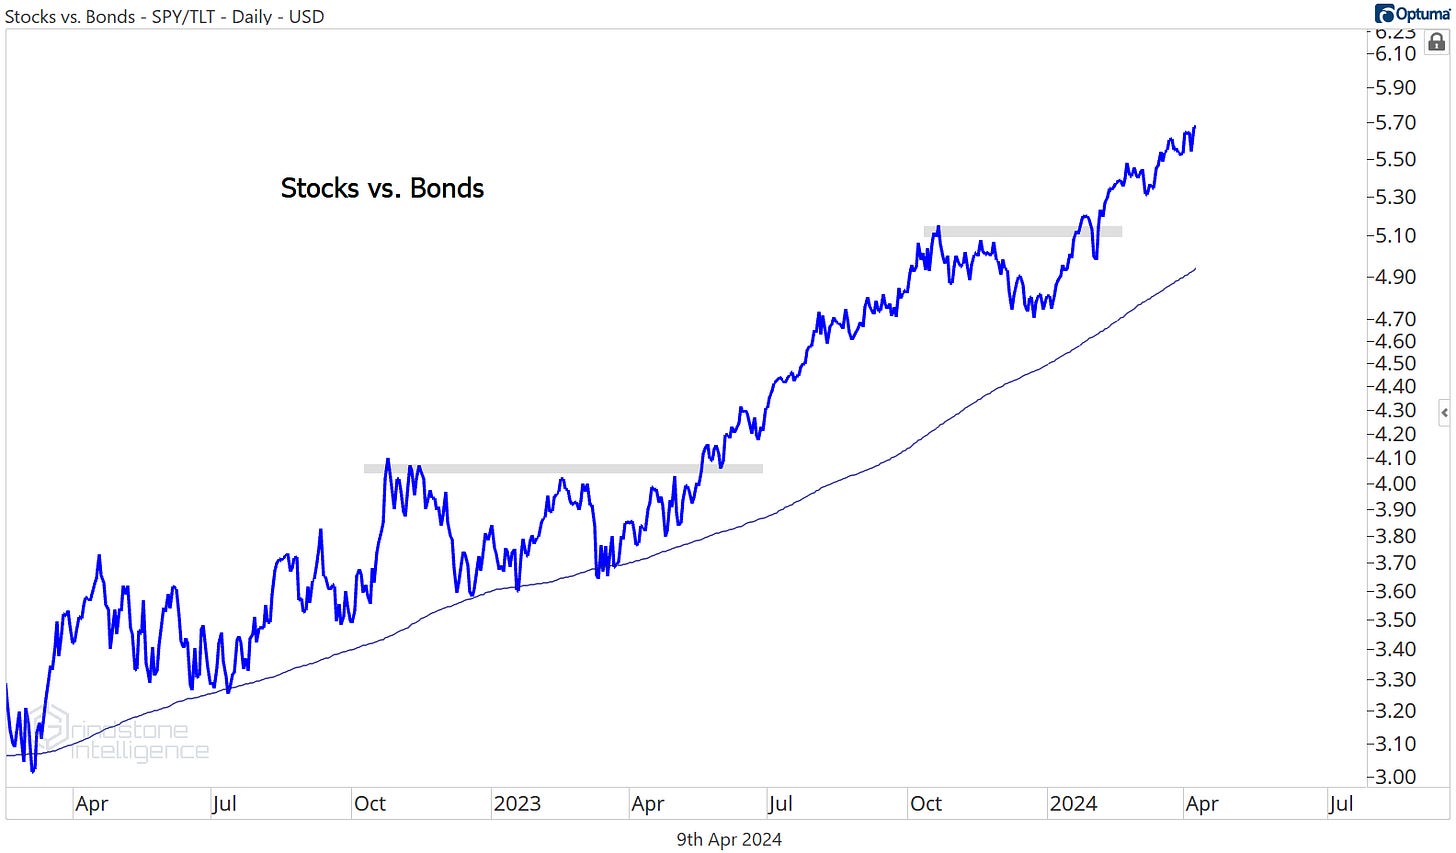
In today’s market, equities have the clear upper hand relative to bonds. Take this ratio of the S&P 500 (SPY) compared to long term Treasurys (TLT). Yesterday, the stock market was hitting new all time highs relative to the bond market.
Of course, this chart doesn’t tell the whole story. Treasury yields are higher these days than they were for the decade leading up to COVID, and that makes them a more compelling instrument for income-focused investors than they’ve been in awhile. But from a competition aspect, equity prices are clearly rising faster than bond prices, and that’s something we should expect to see during healthy bull markets.
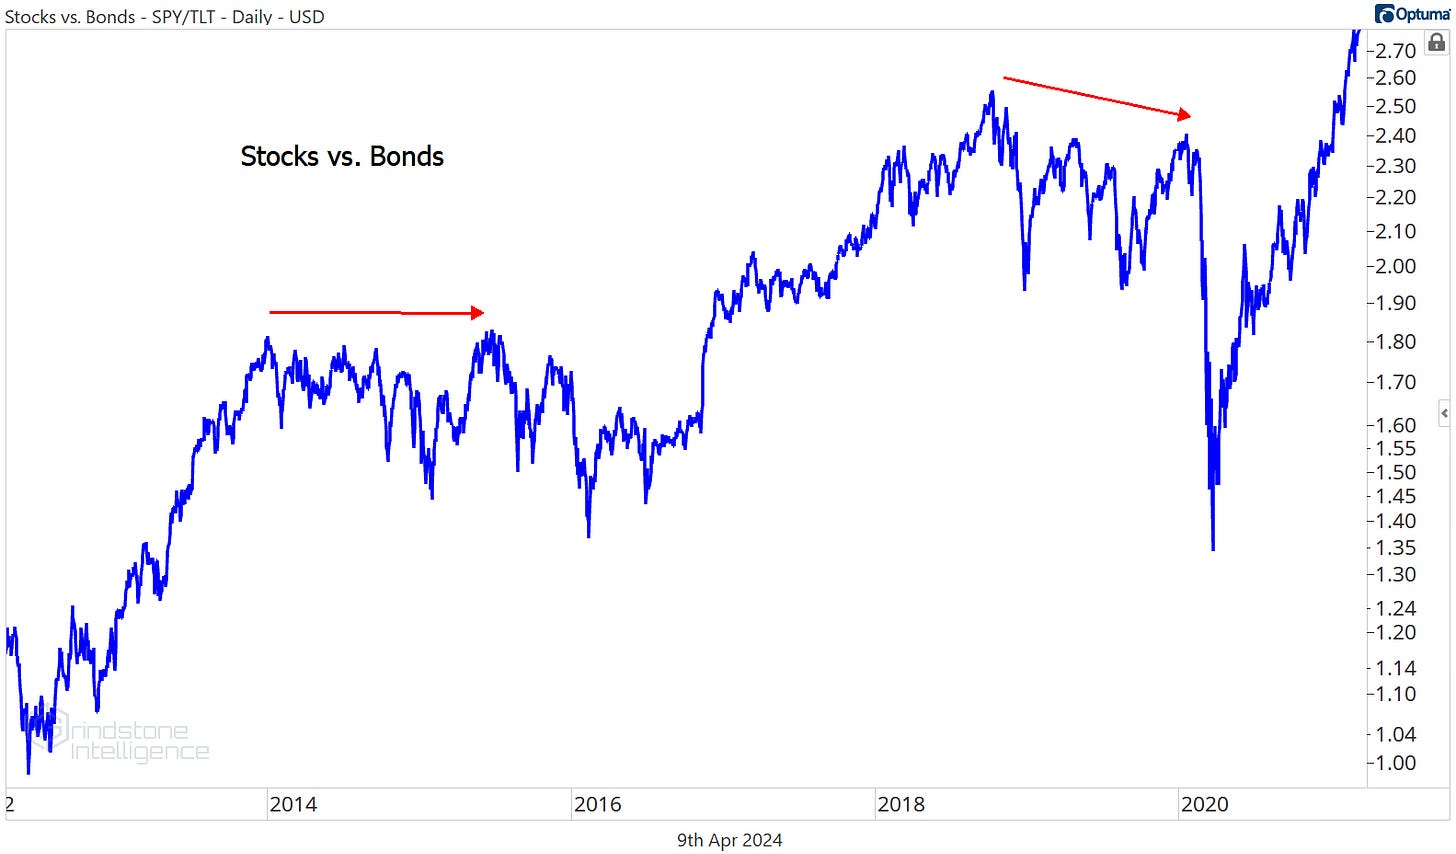
Check out how this ratio acted during somewhat less healthy periods. Stocks were still going up in 2014-early 2015, but we saw the bond market keeping pace with stocks over that period. Then the wheels fell off in August 2015. The same goes for the 2018-2019 period. It’s very different from what we’re seeing today, where the equity market clearly has the upper hand.
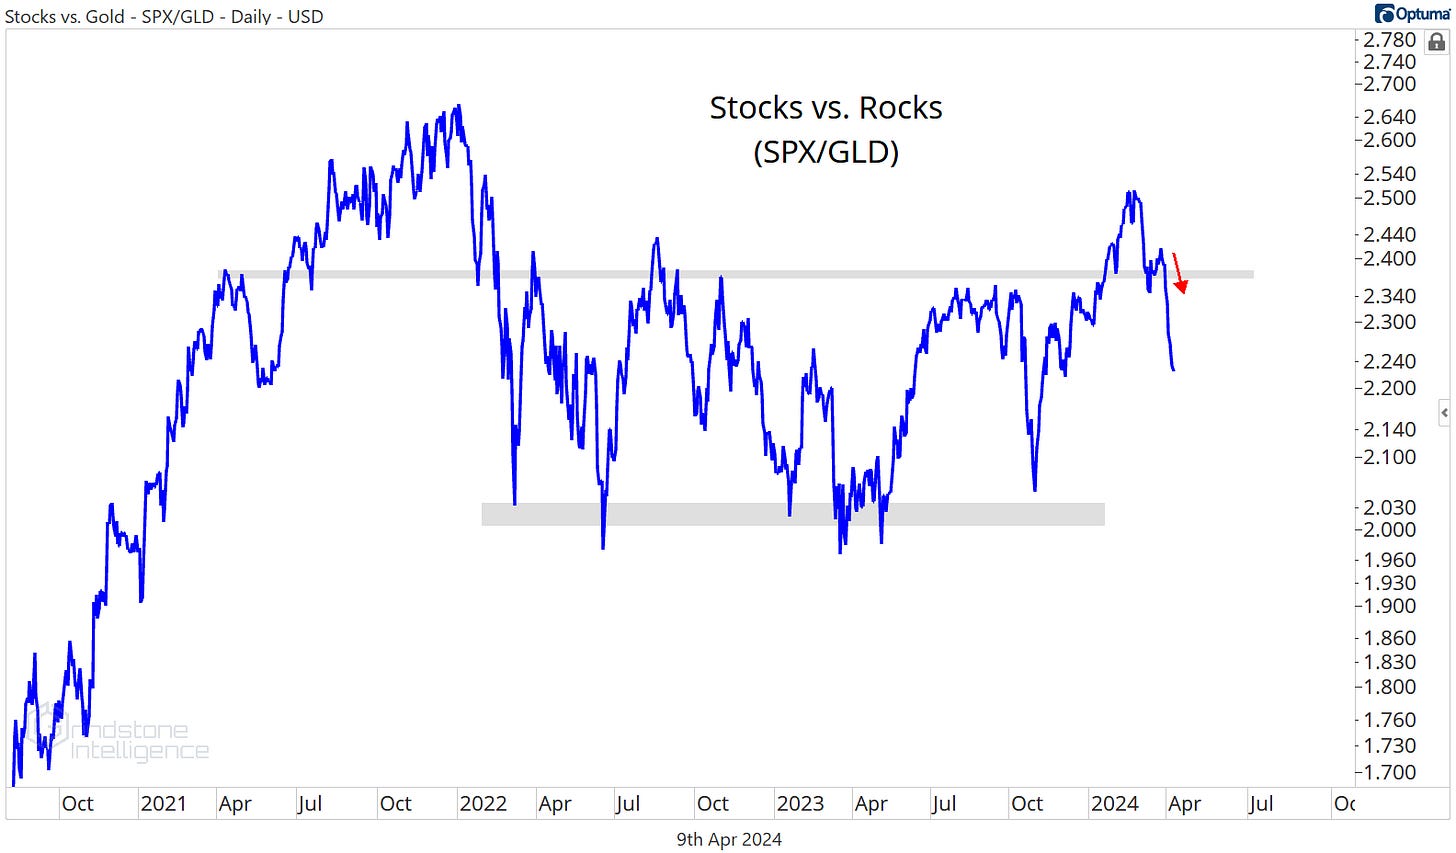
Where equities don’t have the upper hand is relative to commodities. They did a couple of months ago, but not anymore. Here’s the Stocks vs. Rocks ratio (S&P 500 vs. Gold):
As long as SPX/GLD was above that key rotational level from 2021-2023, we needed to be betting on further outperformance from stocks. But gold’s breakout to new highs has brought that ratio right back into the multi-year range. Hate on gold all you want, but there’s been no benefit to holding equities over those shiny pet rocks for the past 3 years.
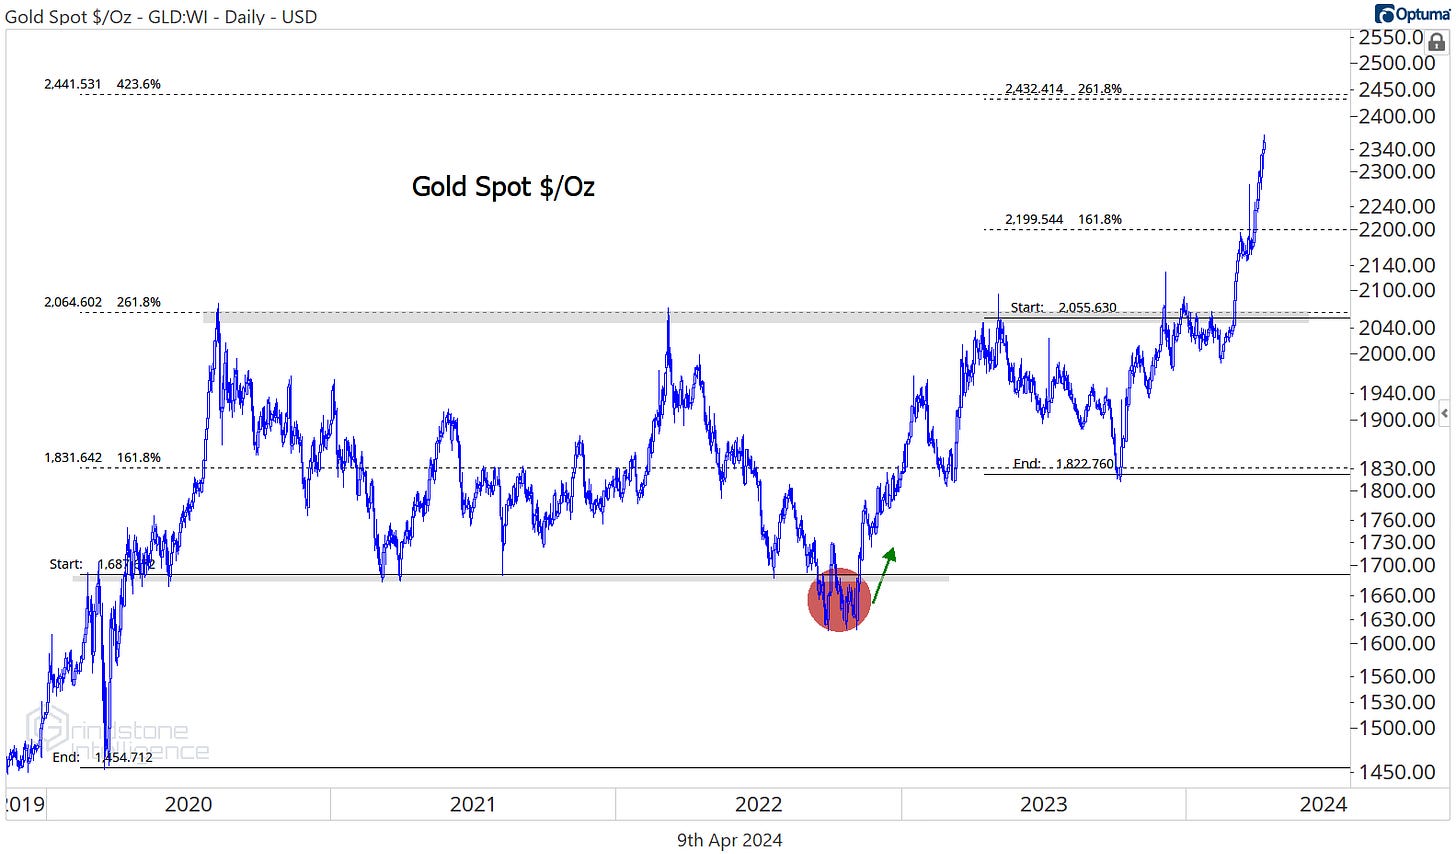
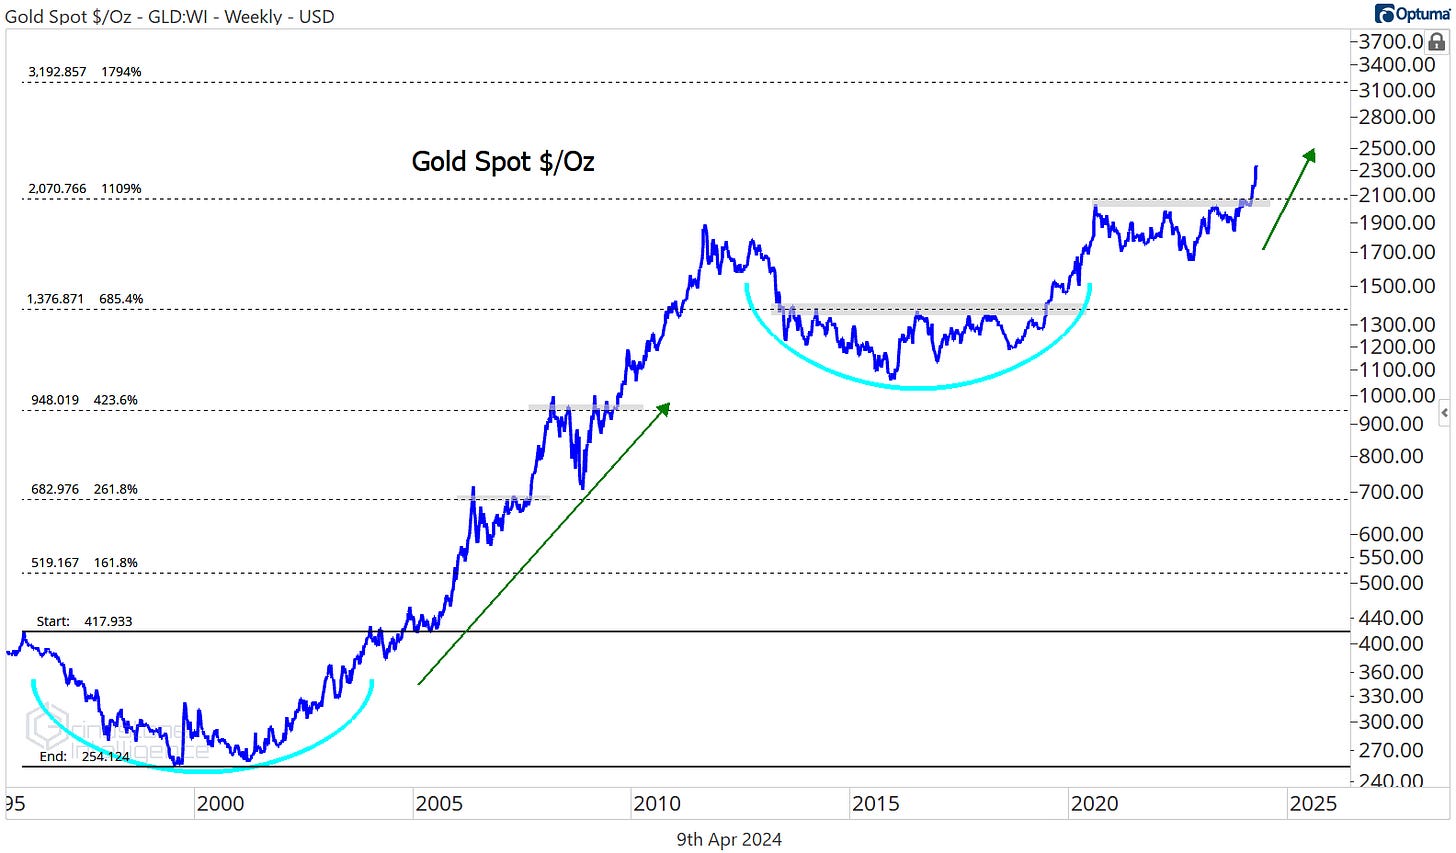
Here’s a closeup of the breakout in gold. It sure took its sweet time - three and a half years of it - but gold finally absorbed all that supply between $2000 and $2100. That level was also the 261.8% retracement from the COVID selloff in March 2020:
Now that we’re in unprecedented territory, we’re looking again to those Fibonacci retracement levels to find potential areas of future resistance. The next one to watch is $2400, which is the 261.8% retracement from last year’s selloff and the 423.6% retracement from the March 2020 selloff. That cluster of Fibonacci retracements should draw prices higher, with $2200 acting as support on any pullbacks.
There could be more to it than that. A move to $2400 would be a huge win for the bulls, but it’s fairly conservative from a big picture point of view. We’re eying $3200 longer-term, which is the 1794% Fibonacci retracement from the 1990s decline. Prices have respected these retracement levels all the way up: The hiccups in 2006 and 2008 occurred near Fib levels, the ceiling from 2013-2019 was the 685.4% retracement, and for the last few years we were stuck below the 1109% retracement. It would make a lot of sense to go up and touch that next level. Even $3200 might be too conservative of an expectation – prices rallied a lot more after the 2004 breakout.
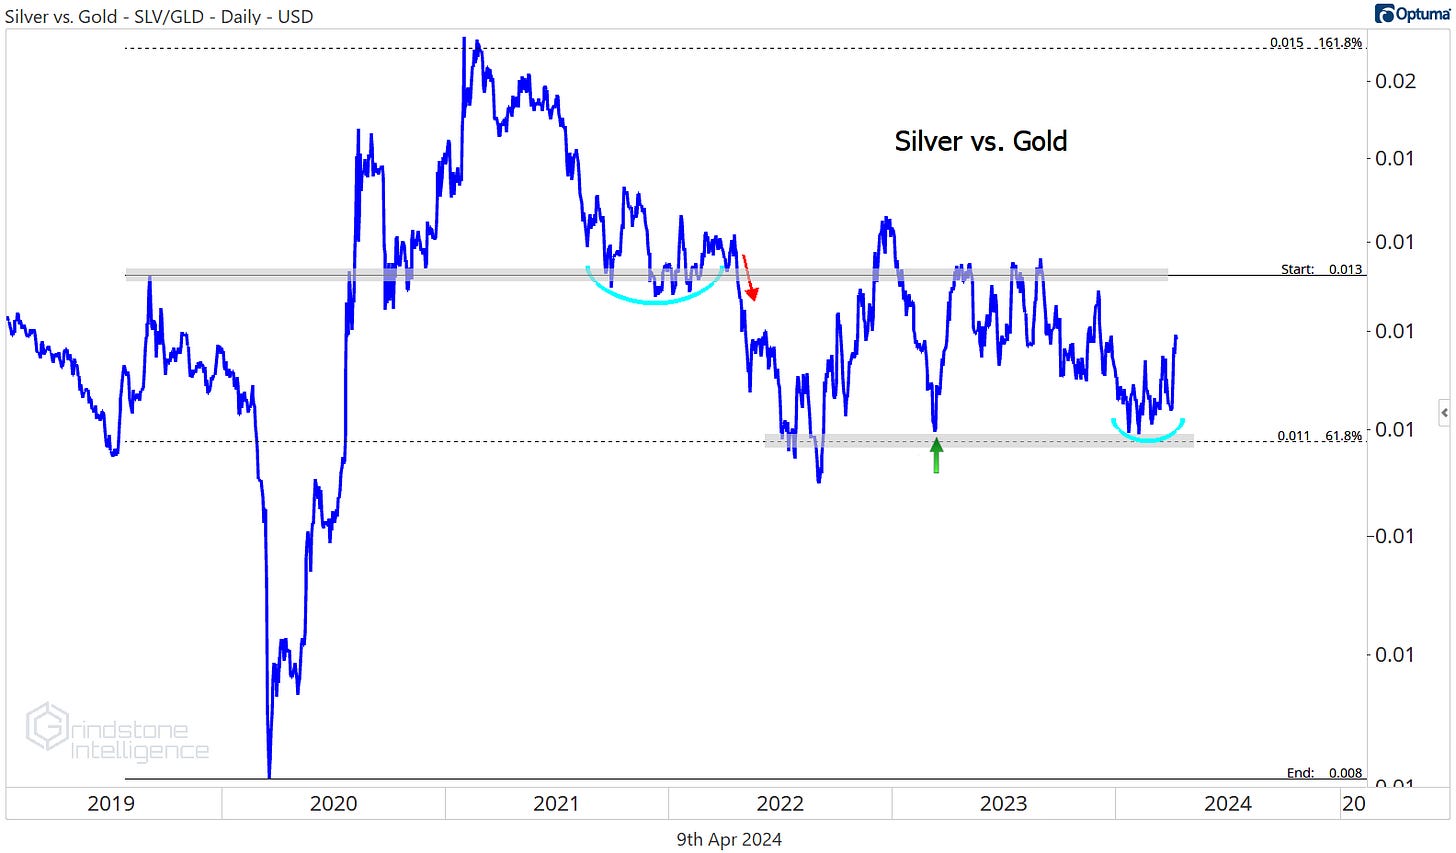
What is it going to take for gold to get all the way there? Continued participation from silver would sure help. Prices for silver and gold tend to be highly correlated, but silver tends to move in greater magnitudes. As such, when precious metals are rising, we expect silver to outperform. That’s what we’ve typically seen during gold’s best run, and that’s something that had been lacking for most of 2022 and 2023.
Keep a sharp eye on this one, though. Gold is up more than 15% since then end of February, but silver is setting new year-to-date highs vs. gold!
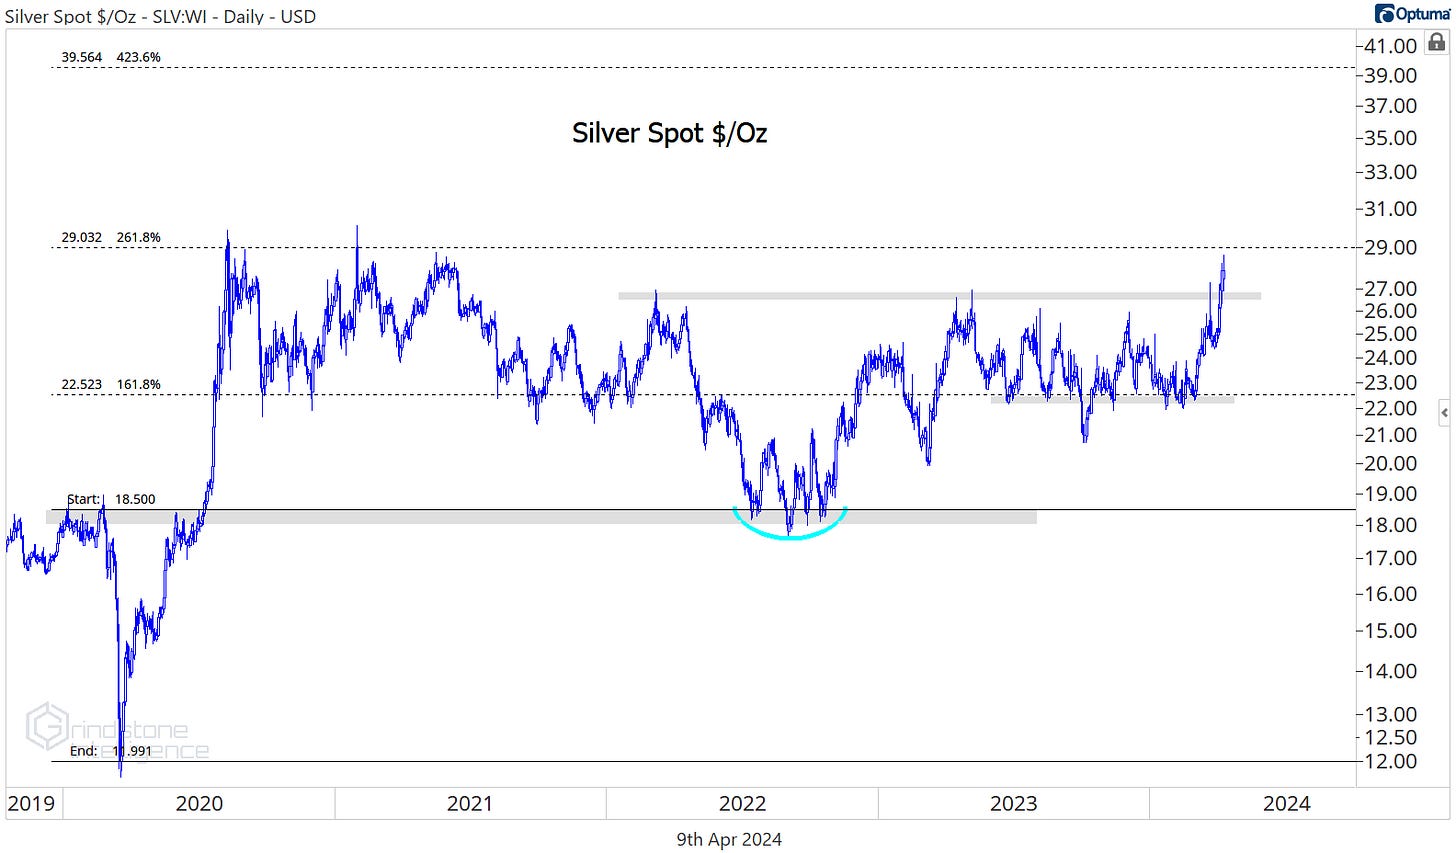
Silver came out of nowhere to erase more than two years of absolute mess. Now it’s knocking on the door of a major breakout. If silver is above $29, we think it can rally all the way to $39, which is the 423.6% retracement from the 2020 decline:
These precious metals breakouts certainly stand out, but don’t be fooled into thinking this is evidence of a flight for safety. People do tend to buy gold when they’re afraid, but they don’t buy gold only when they’re afraid. Sometimes gold and stock prices rise together. From the S&P 500’s bear market lows to its 2007 highs, gold rose even more. Gold breaking out isn’t bearish.
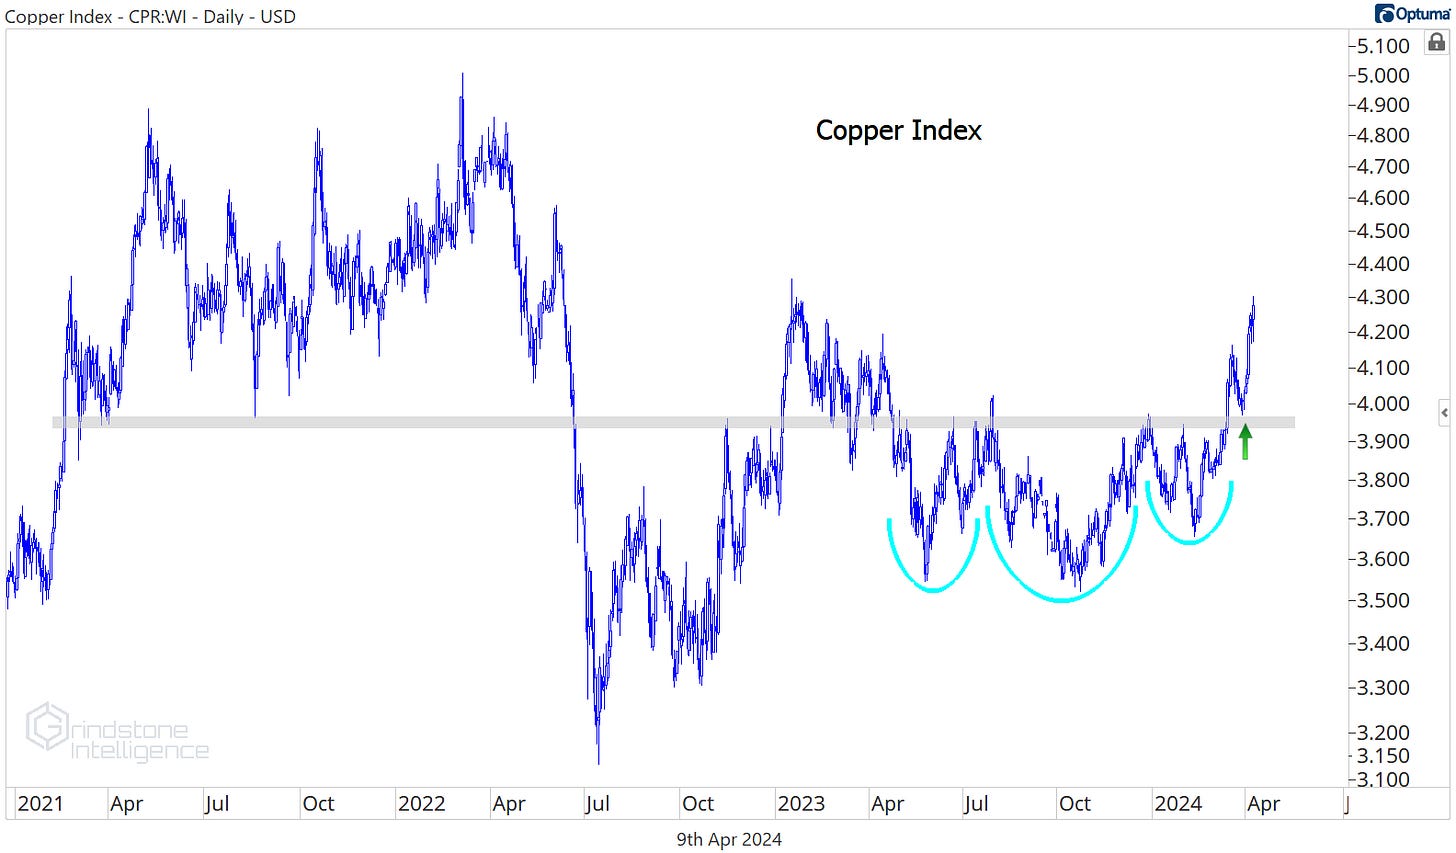
Moreover, the rise in gold and silver prices is a reflection of the broader strength we’ve seen in commodities of late. Check out copper setting new 52-week highs.
Yes, copper is still a gigantic mess without a clearly identifiable trend. But the trend certainly isn’t down. Not now that its trading back above former resistance at $4.
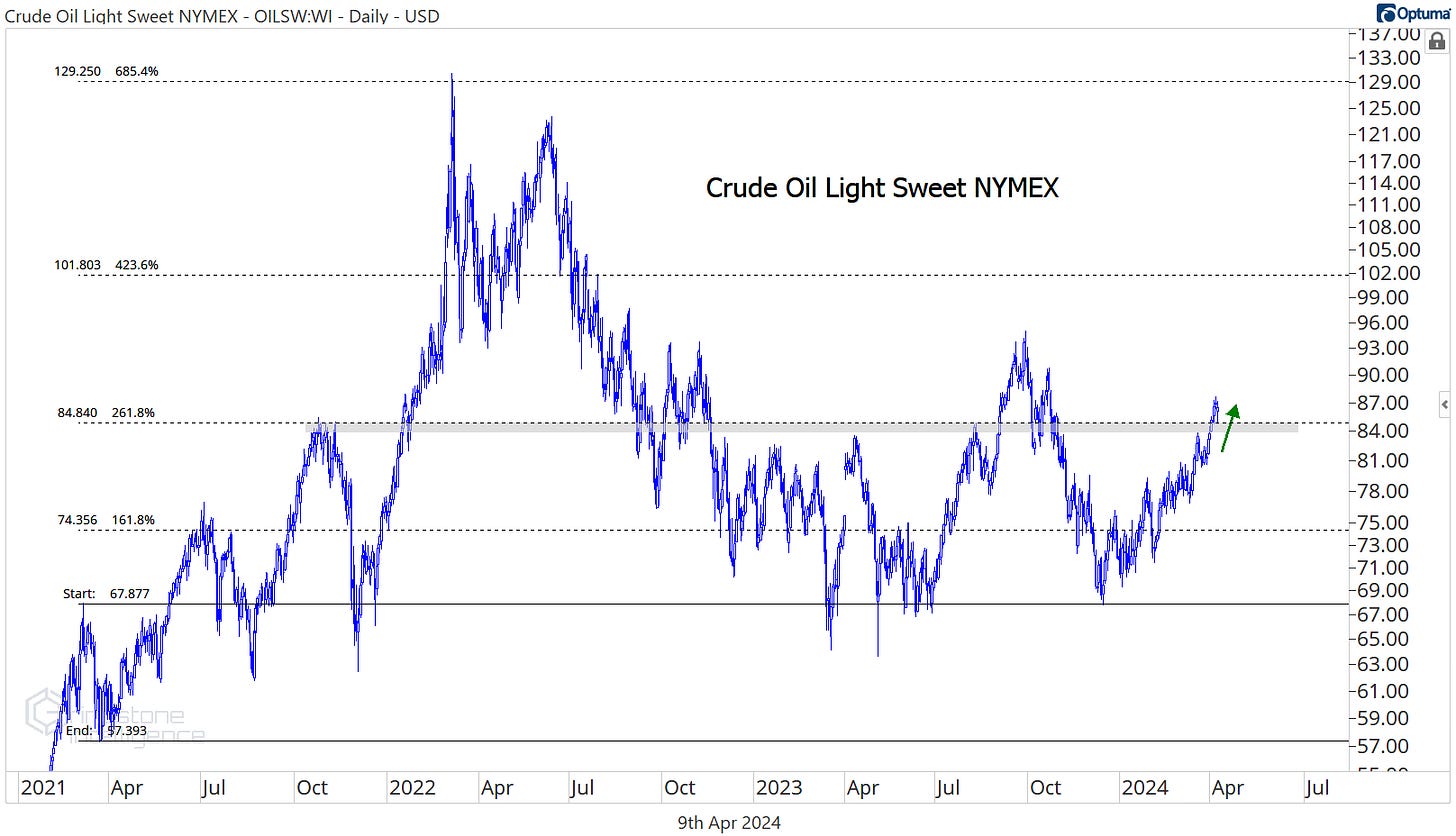
And for crude oil, a 20% year-to-date rally has WTI back above a key level of its own.
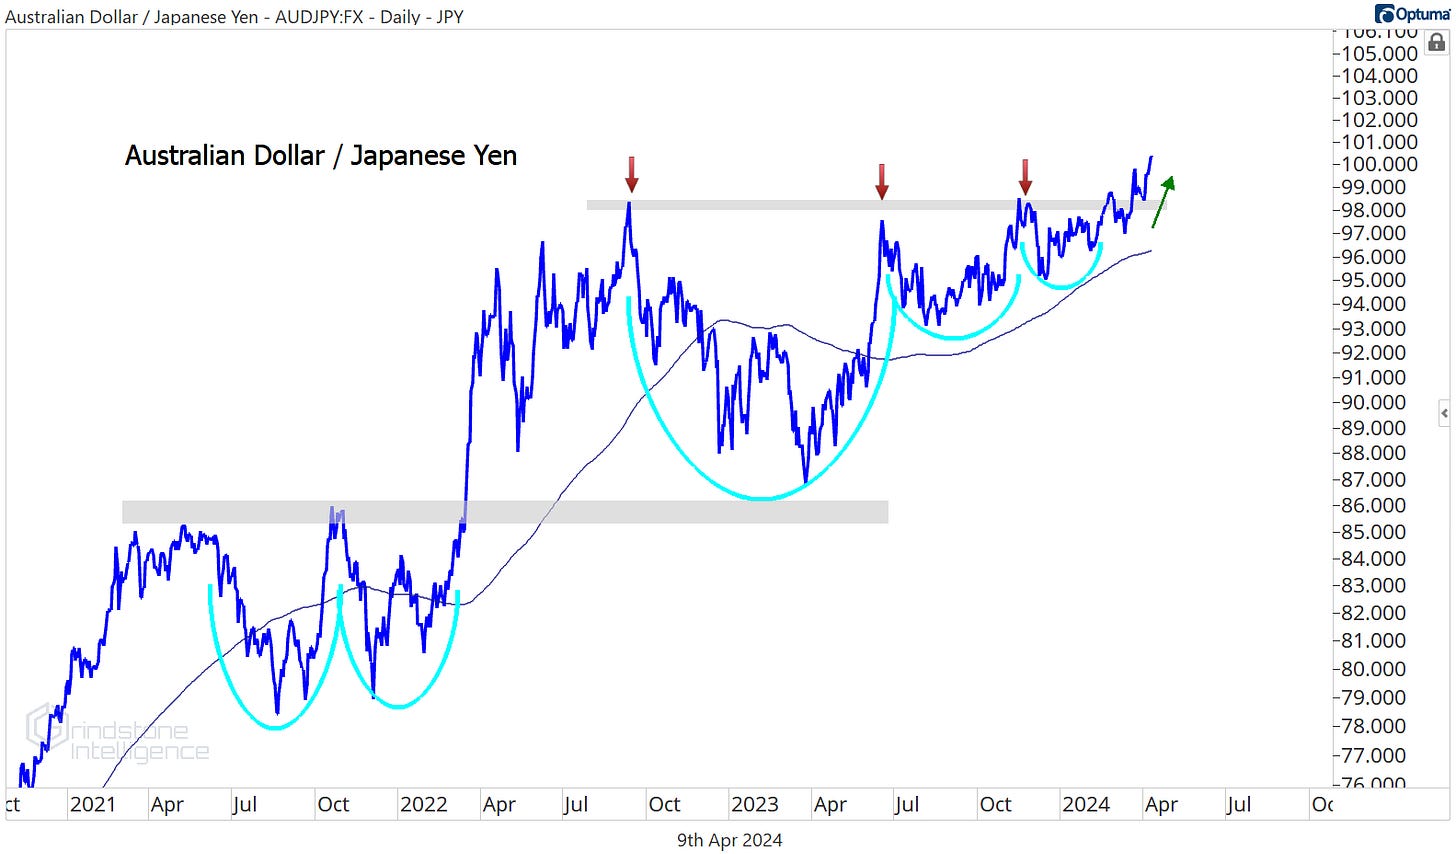
That’s all consistent with what we’re seeing in the currency markets. The Australian Dollar is considered a risk-on commodity currency and the Japanese Yen is a traditional safe haven. As such, the AUD/JPY often mirrors moves in commodity prices. And the AUD just broke out of an 18 month base versus the JPY.
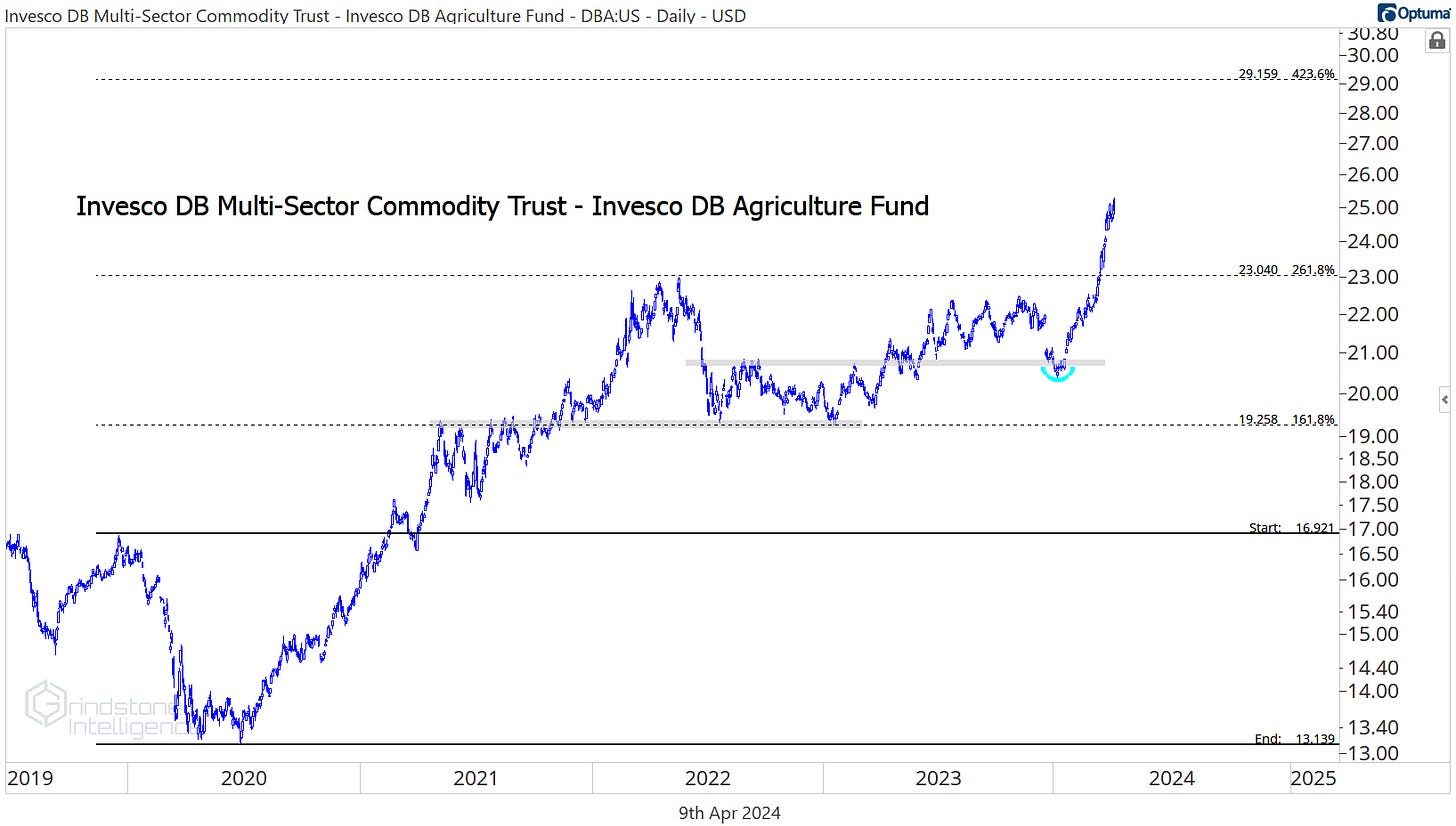
It’s precious metals, it’s base metals, it’s energy, it’s the entire commodities space. Even the softs. The Invesco DB Agriculture Fund just broke out of a 2 year base.
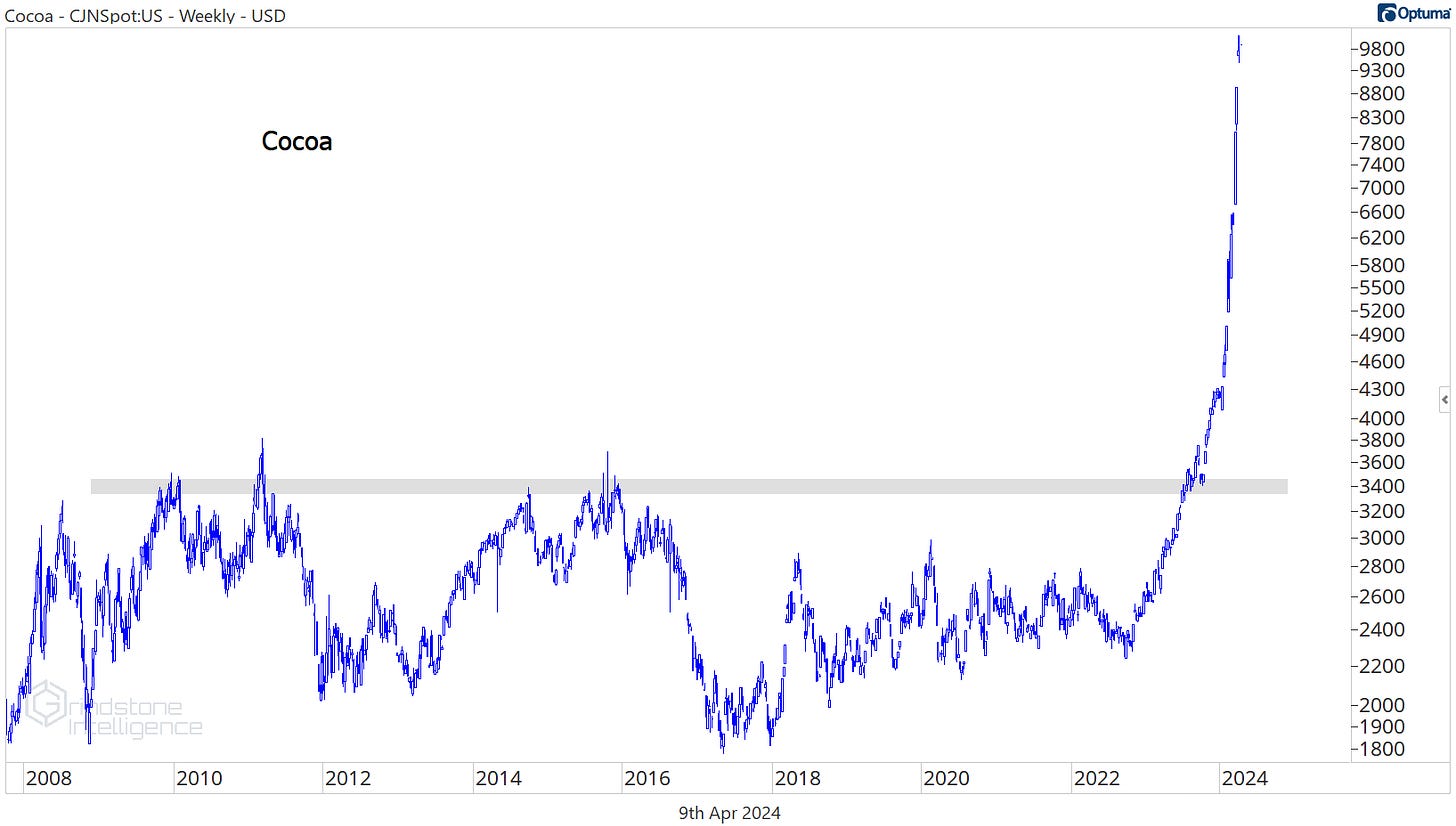
To be fair, a lot of the strength in DBA can be attributed to one key component: Cocoa is cuckoo.
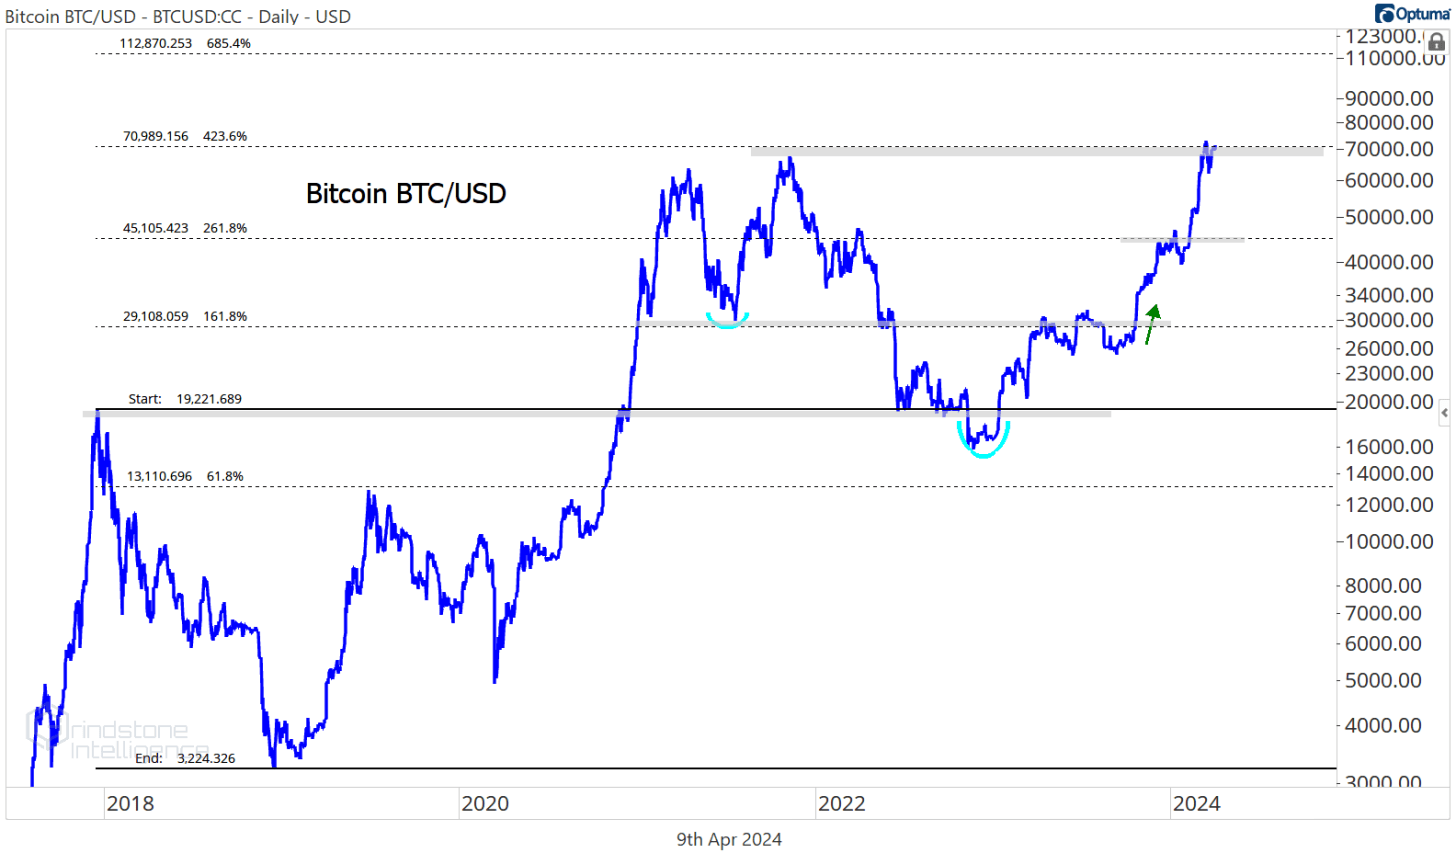
Are we calling Bitcoin a commodity, too? It’s tough to call it a true ‘currency’, at least until we see the local grocery store accepting BTC at the checkout line, so commodity feels more appropriate to us. At the end of the day, it doesn’t really matter how we define it. Bitcoin is right up near all-time highs.
Do prices eventually go higher from here? Probably. If we can move past this resistance level and hang above 71k, then we can set a new target of $112k, which is the 685.4% retracement from the 2018 selloff.
But it’s interesting that while similar assets like gold and silver have been actively surging over the past month, Bitcoin hasn’t gained any ground. Maybe crypto will be the best asset class over the next decade. If it is, will there be any harm in waiting to see that breakout before getting involved, rather than jumping on board now and hoping for one? We don’t think so. Especially when presented with the opportunity cost of not being involved in the areas that are rising.
That’s all for today. Until next time.


