December Market Outlook
Rotation, Rotation, Rotation
At the outset of every month, we take a top-down look at the US equity markets and ask ourselves: Do we want to own more stocks or fewer? Should we be erring toward buying or selling?
That question sets the stage for everything else we're doing. If our big picture view says that stocks are trending higher, we're going to be focusing our attention on favorable setups in the sectors that are most apt to lead us higher. We won't waste time looking for short ideas - those are less likely to work when markets are trending higher. We still monitor the risks and conditions that would invalidate our thesis, but in clear uptrends, the market is innocent until proven guilty. One or two bearish signals can't keep us on the sidelines.
Similarly, when stocks are trending down, we aren't looking to buy every upside breakout we see. We can look for those short opportunities instead, or look for setups in other asset classes.
So which is it today? Are we looking for stocks to buy or stocks to sell?
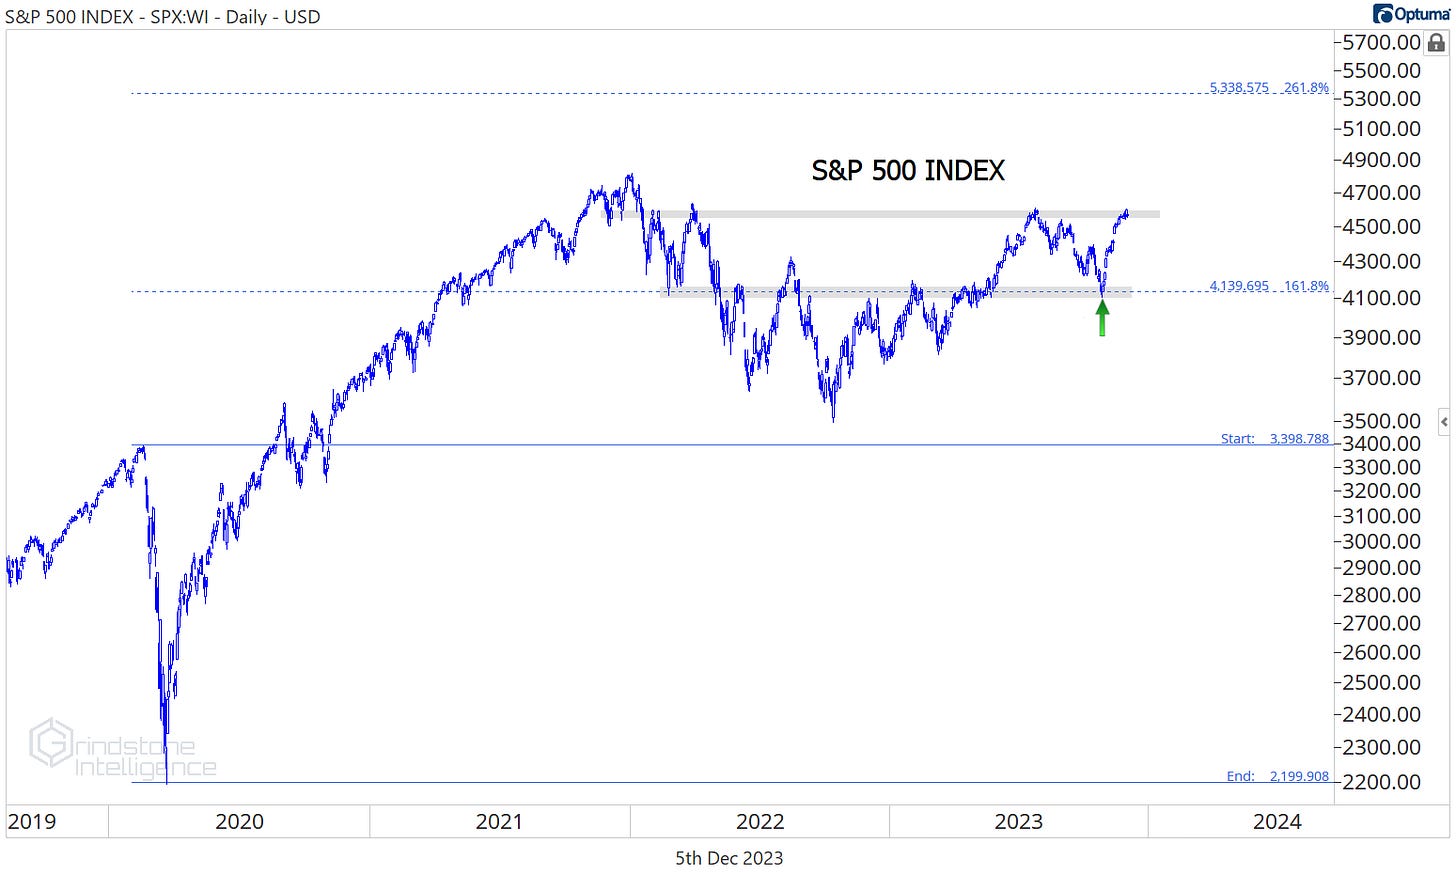
In late October, there were plenty of reasons to be bearish. Breadth was weaker than it had been all year, interest rates were on the rise, and the micro-caps were breaking down to new lows. We highlighted those risks in our November outlook, but we cautioned the bears. The S&P 500 was still above our line in the sand at 4150, and there's a reason we have these levels.
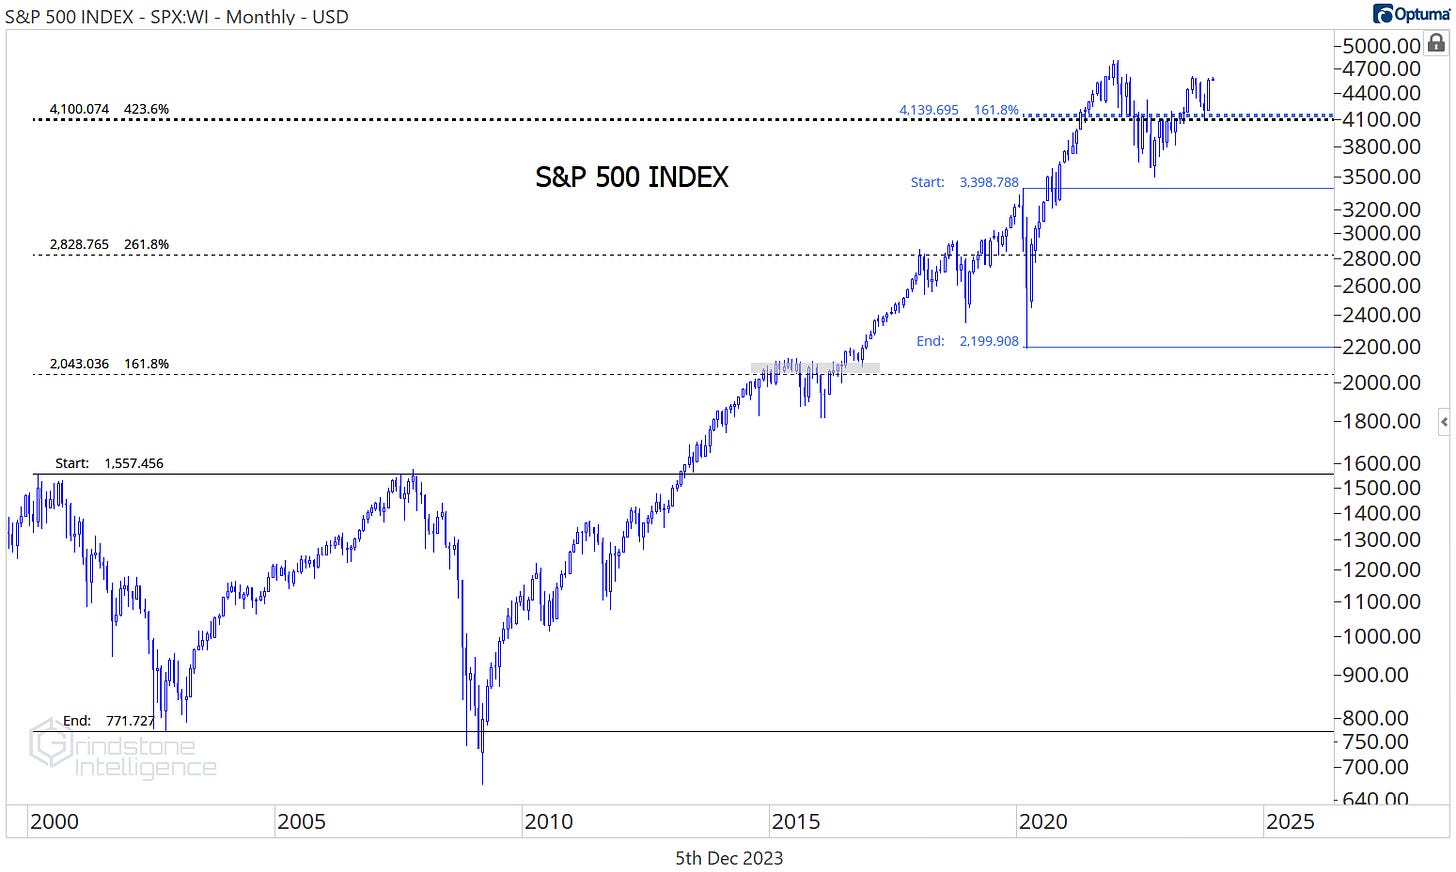
This 4150 isn’t just some number we pulled out of a hat. It’s the 161.8% Fibonacci retracement from the 2020 bear market. And if you’re inclined to zoom out to the past 25 years, you’d find that level is also the 423.6% retracement from the dotcom crash at the turn of the century. It’s no coincidence that 4150 was support in early 2022 and then became resistance on rallies in the latter half of ‘22 and the early part of ‘23. The market respects these Fibonacci markers, so we do, too.
We didn’t abandon our bullish thesis in November with stocks still trading above 4150, and our discipline paid off. Stocks rallied nearly 9% in one of the S&P 500’s best months ever.
As we enter the final month of the year, we see no reason to change our overall outlook, even as the S&P 500 is challenging its summer highs at 4600. It may take some time to digest some of this overhead supply, but the index is undoubtedly in an uptrend, and we believe this 4-month consolidation will resolve in the direction of that underlying trend. Our target for the S&P 500 is 5330, which is the 261.8% retracement from the COVID decline. Only a break below 4150 would make us change our mind.
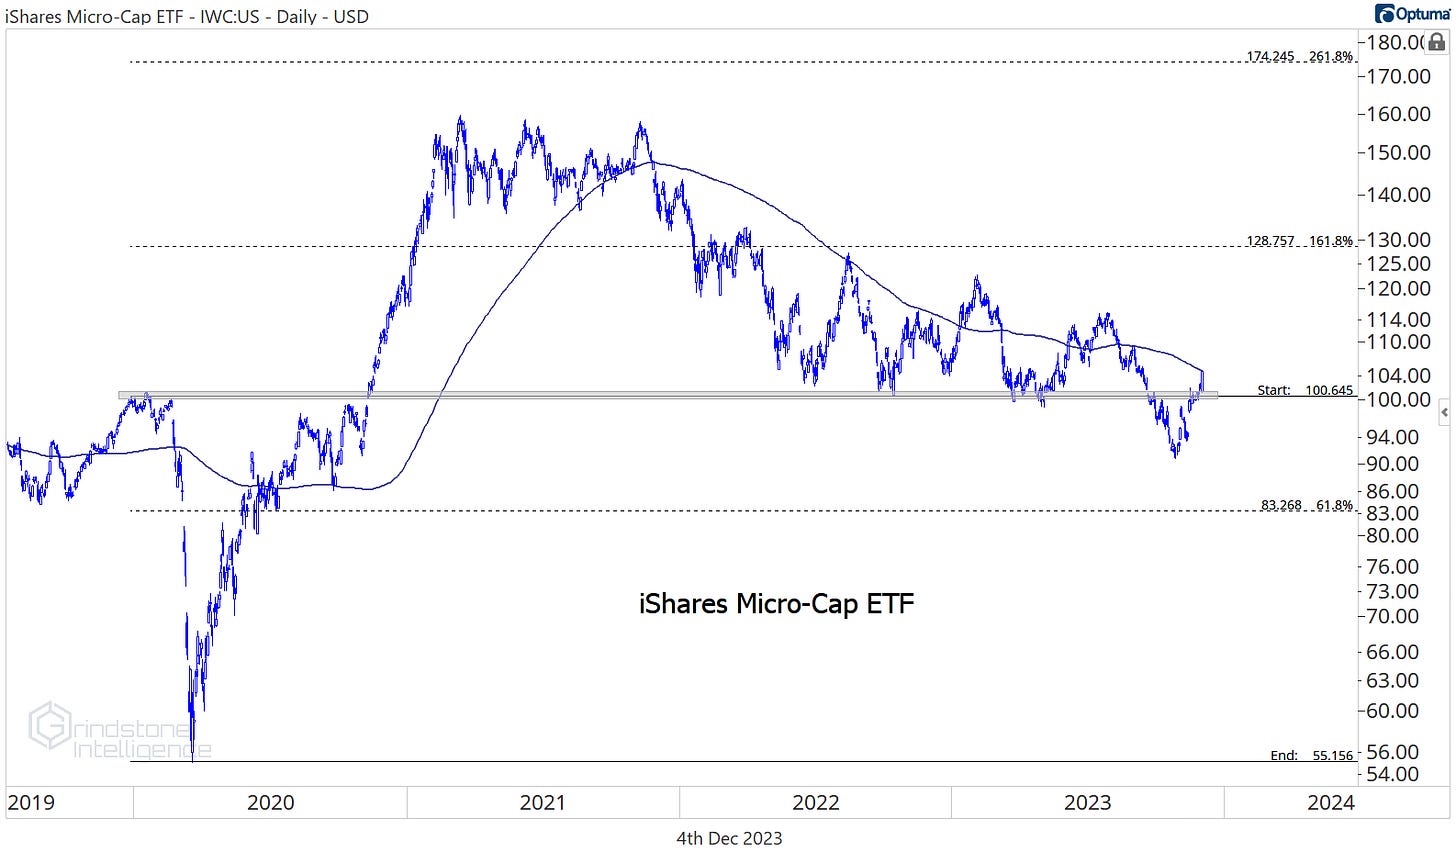
Supporting our bull thesis is how well even the worst stocks are doing. The micro-caps were the clear leader on the downside during the late-summer decline. They touched new 52-week lows in September, then dropped another 9% before the end of October. Fast forward to today, and the group has recovered above its pre-COVID highs. When the bears can’t even keep down the weakest areas of the market, that tells you what type of market environment we’re in.
Want to know something else you see in bull markets? Rotation. First one group of stocks leads, then another. Then another. When one sector runs out of steam, another sector grabs the baton and drags the index higher.
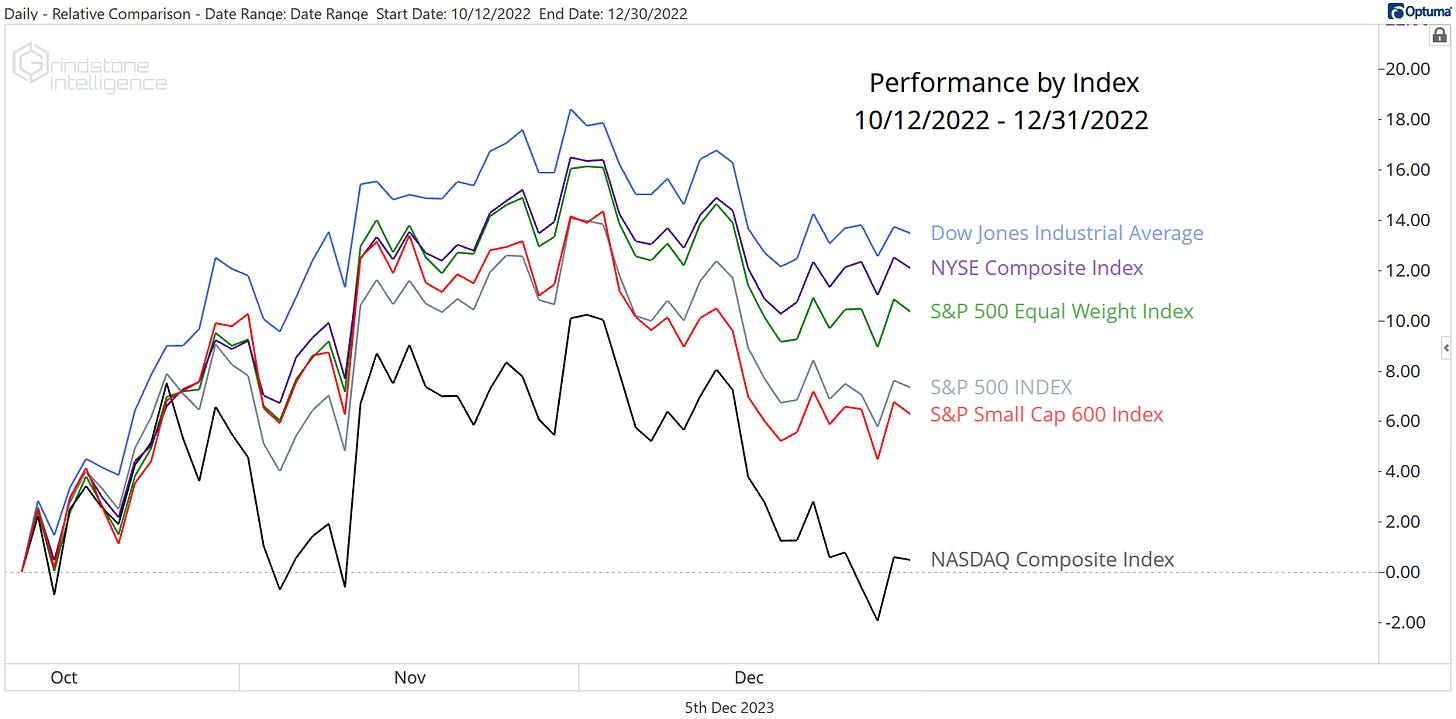
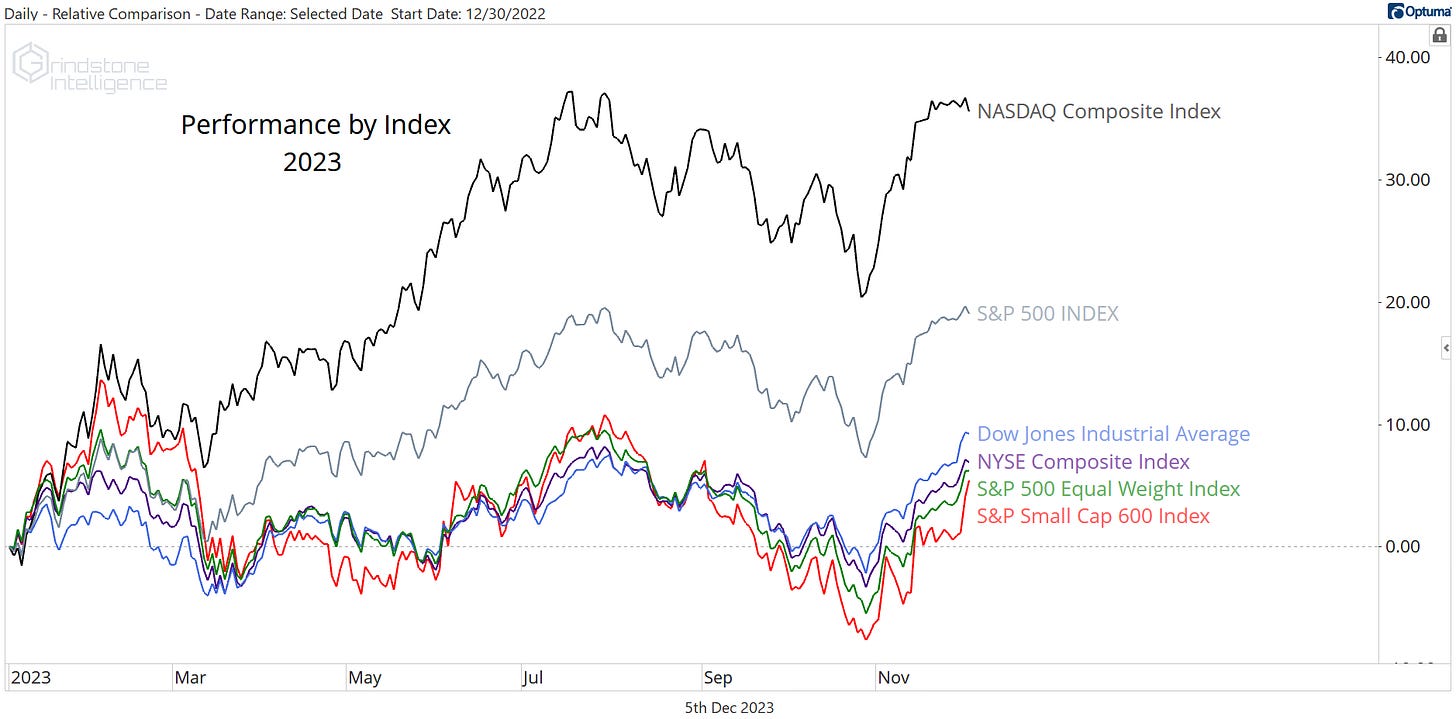
All year it’s been about mega cap tech stocks and the NASDAQ. More often than not, people have complained about the narrow leadership. But it was never just a handful of stocks participating in this bull market. Those same mega cap tech stocks didn’t participate at all during the first leg:
The NYSE Composite rose 12% from the October 12, 2022 lows to the end of 2022. The NASDAQ gained a paltry 0.47% over that same period.
Then returns shifted from the value-tilted Dow Jones Industrial Average to the growth-oriented NASDAQ in 2023. Rotation, rotation, rotation.
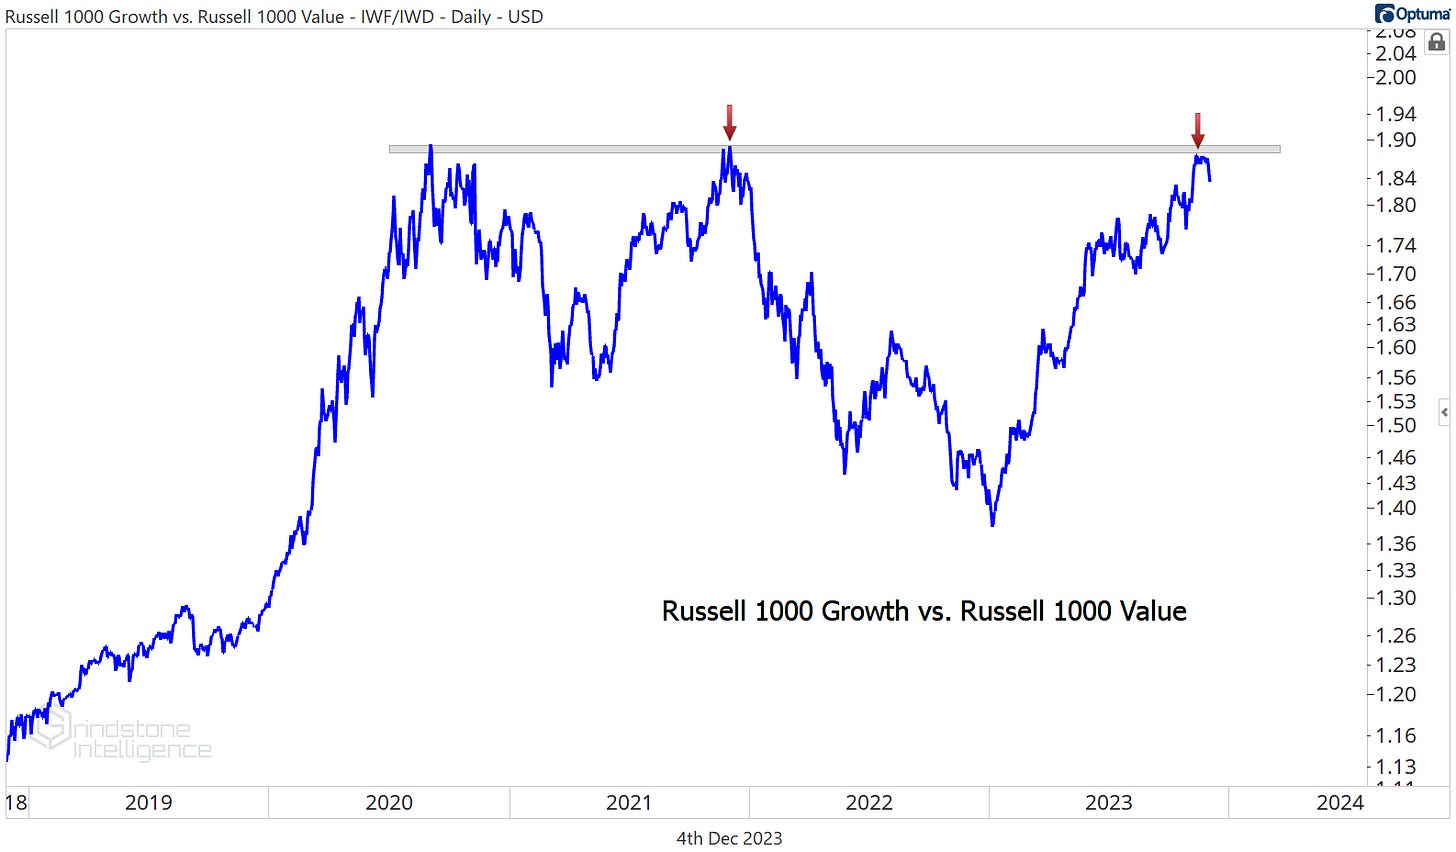
Going into December, it looks like value is ready to grab the baton once again. Check out the Russell 1000 Growth Index vs. Russell 1000 Value. This is the exact place the ratio peaked in 2020 and 2021.
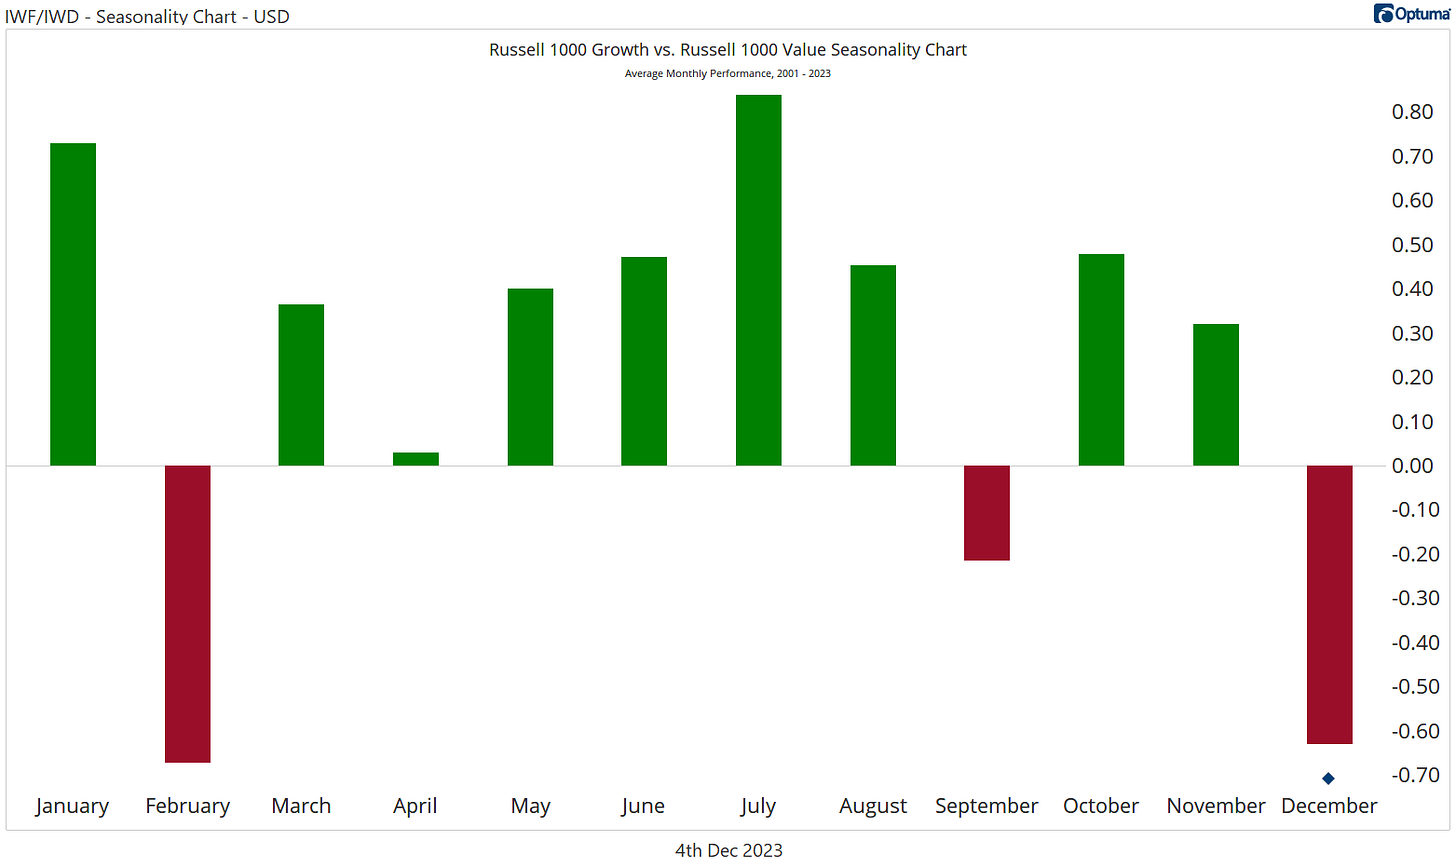
And for the ratio, December is one of the worst months of the year. Over the last 20 years, Growth stocks have underperformed Value in 39% of Decembers - that’s the lowest win rate for any month - and by an average of 0.6%.
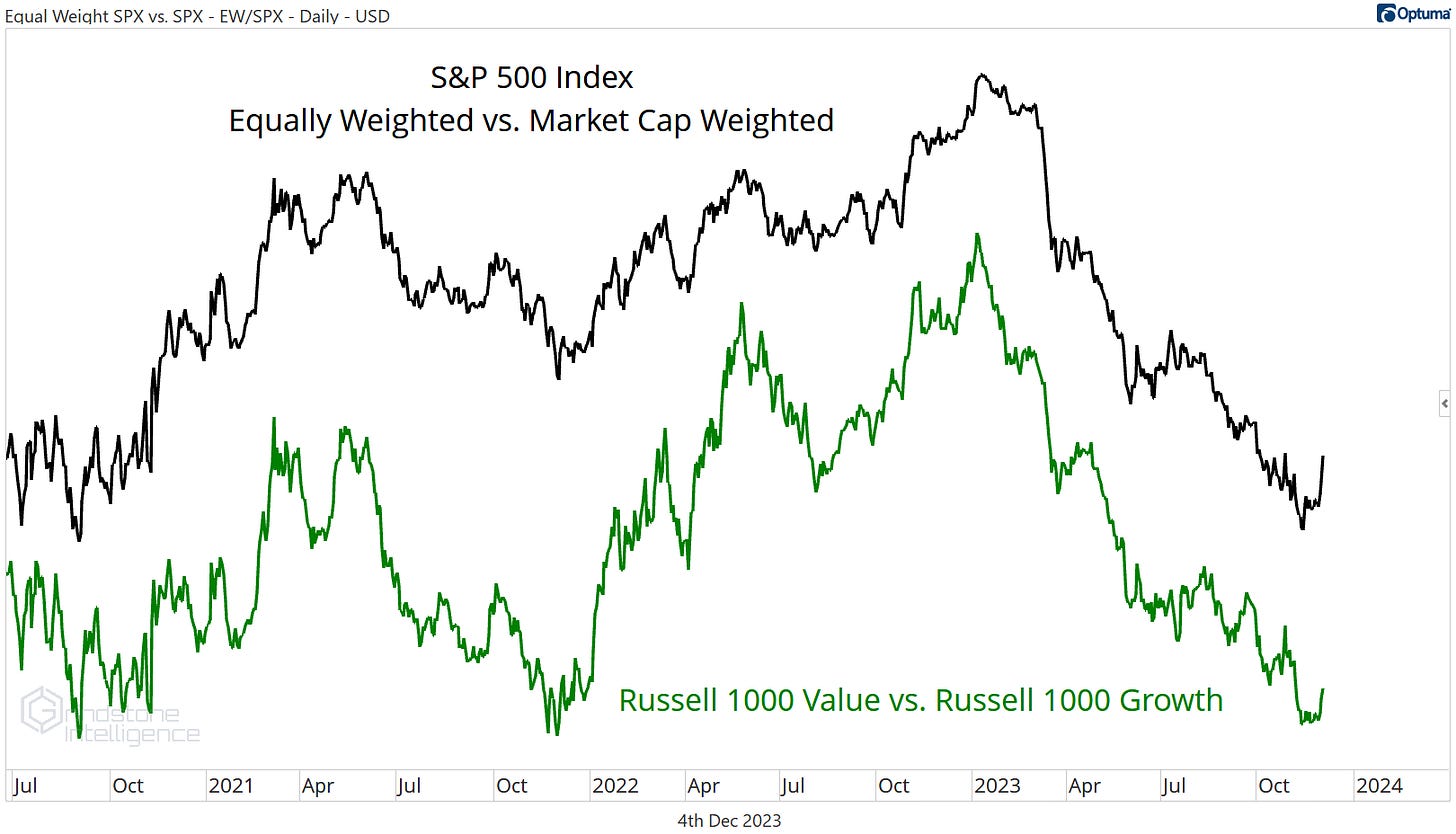
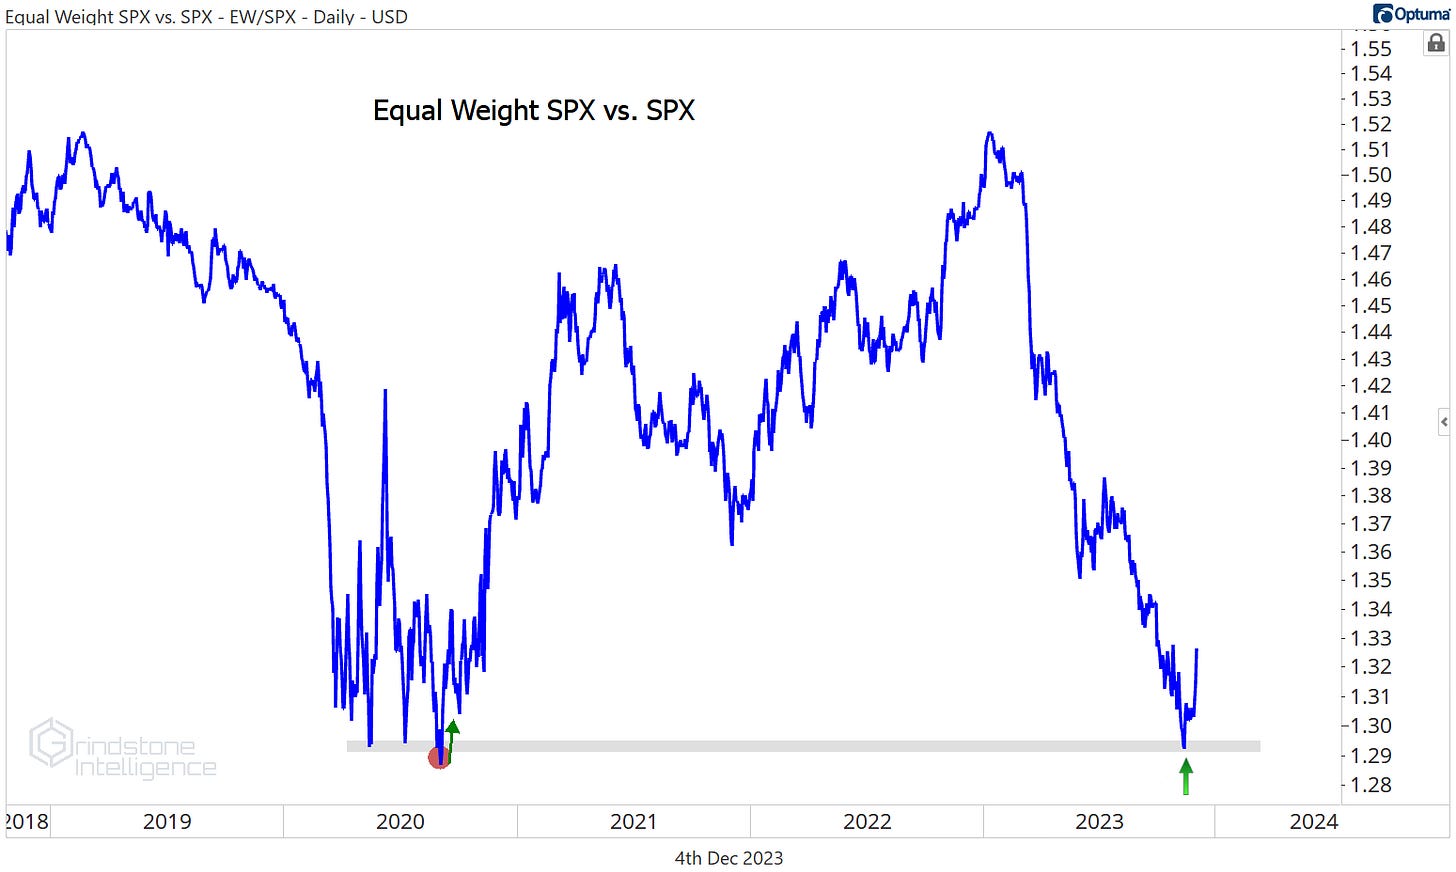
Renewed leadership by value is synonymous with renewed leadership by the average stock. Check out the ratio of the equally weighted vs. market cap weighted S&P 500 and compare it to the value vs. growth ratio. The two are nearly identical.
And this is a perfectly logical spot for the equally-weighted S&P 500 to start outperforming the cap-weighted index. This is where the ratio bottomed back in 2020, too. That’s welcome news for stock-pickers: more stocks outperforming the index means better odds of picking the stocks that will outperform.
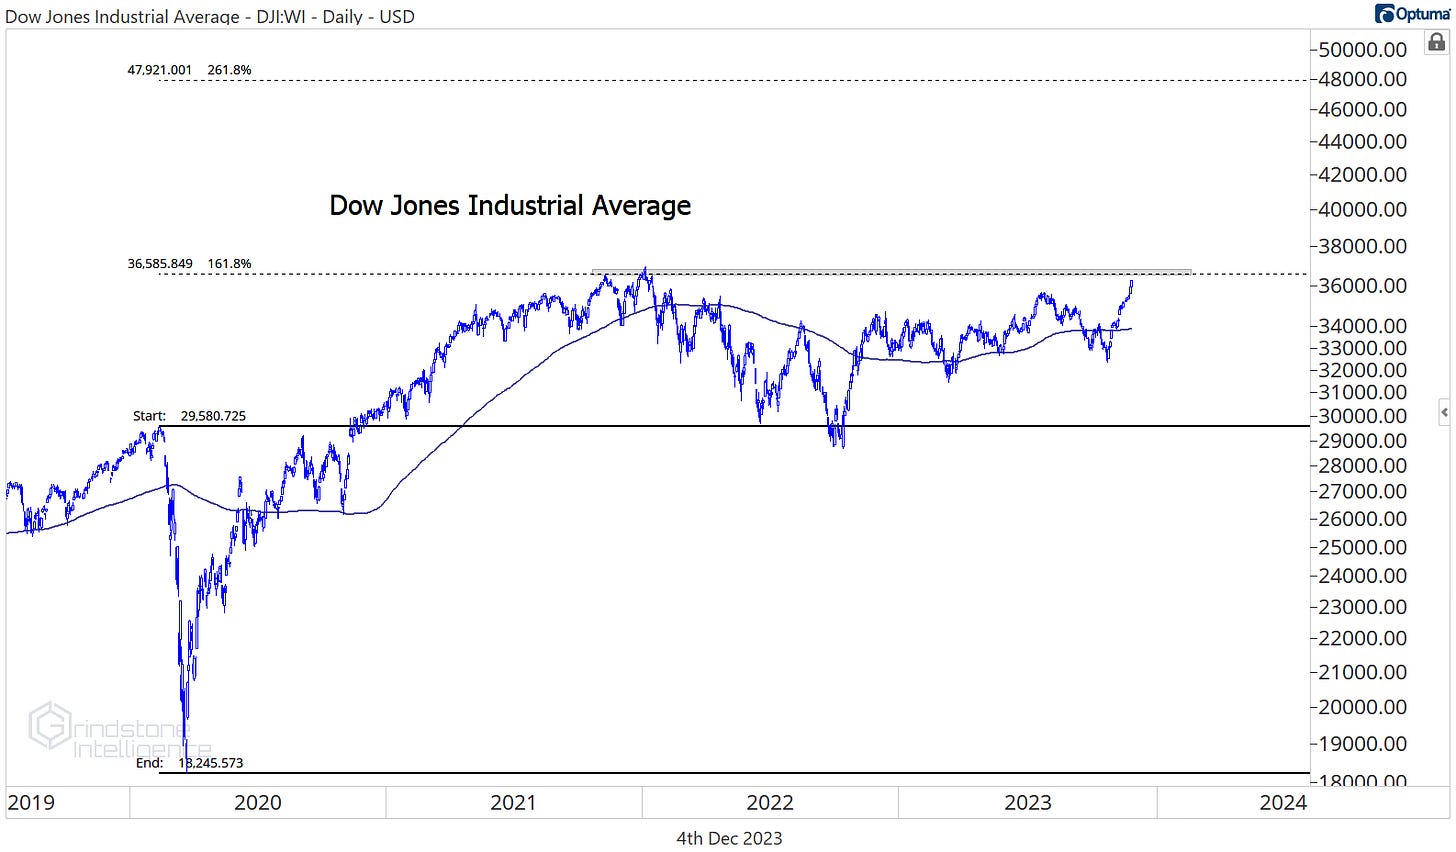
Renewed leadership from Value might also push the Dow Jones Industrial Average to new ALL-TIME highs by the end of the year. We’re less than 2% away from the 36799 peak set in January 2022. No major US index is as close to fresh highs.
We don’t think it’s unreasonable to target 48000 for the Dow, which is the 261.8% retracement from the 2020 decline. That’s 30% higher from here.
Of course, we can’t tell the future any more than you can (maybe we’ll get that crystal ball for Christmas this year). Our job is to identify levels and risks, then use the weight of observed evidence to assign subjective probabilities to potential outcomes. We’re bullish on stocks, yet we’re always ready to change our mind.
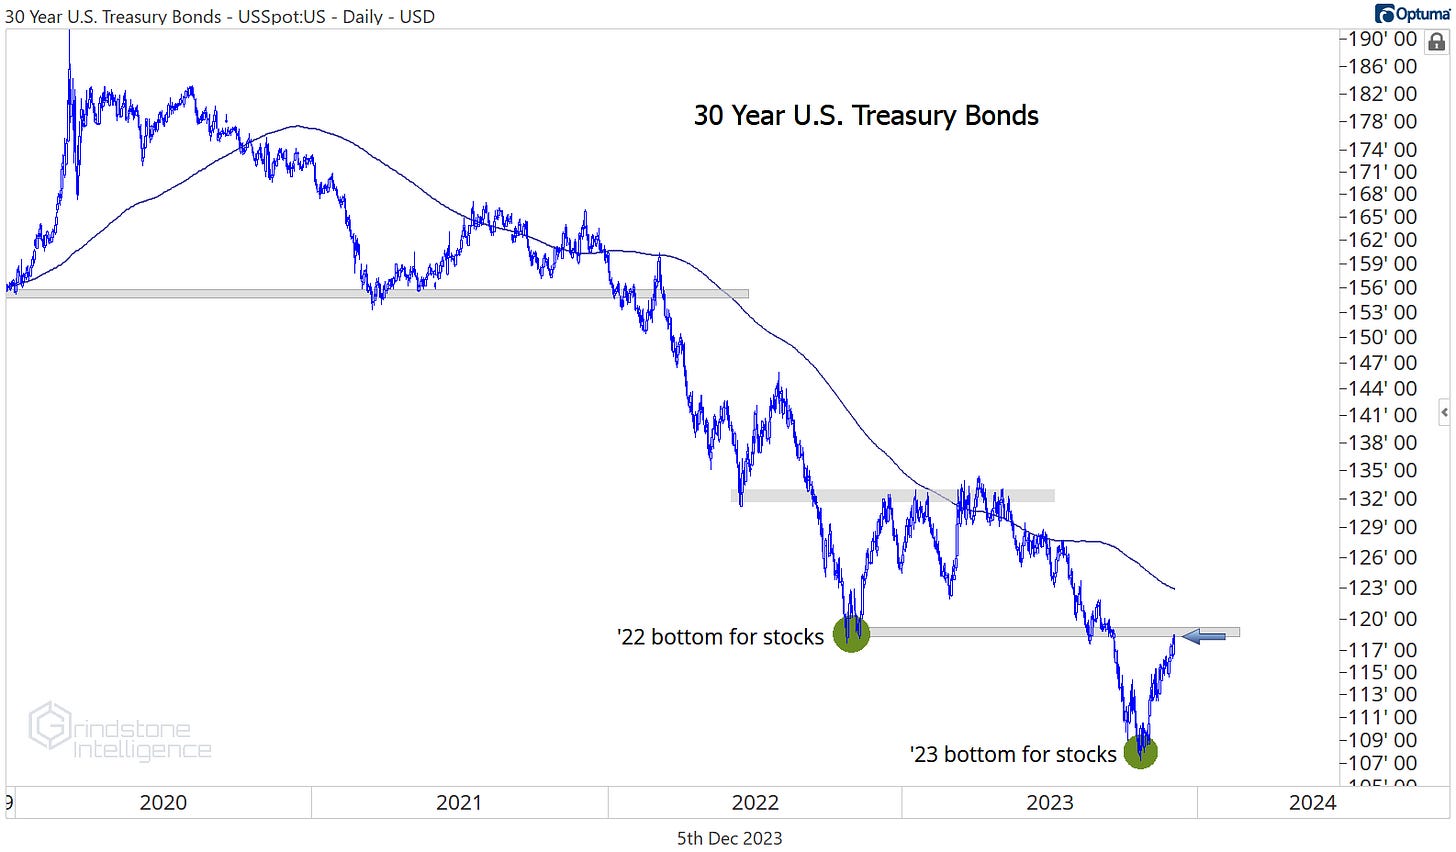
What’s the bear case? We think it’s interest rates. In the 2022 bear market, stocks and bonds traded together. Each time interest rates rose to a new high, stock prices fell to a new low. When bonds finally reached their nadir in October ‘22, that’s when the bear market in stocks ended, too.
For most of this year, bond prices were consolidating above last year’s lows, and stocks were able to rally. But when bonds broke their ‘22 lows in September, the fall selloff in stocks gained steam. It wasn’t until after bonds set a new trough that equities were able to rally in November.
So what if the last few weeks has just been a mean reversion in interest rates? Check out the last 4 years in 30-year Treasury bonds above. Does that look like anything other than a downtrend? What happens if the ‘22 low in bonds acts as resistance and sends rates back to new highs? We don’t know, but we doubt stock prices would love that outcome. It’s definitely something worth keeping an eye on. And if the S&P 500 ends up below 4150, we’ll know our bull thesis for stocks is wrong.
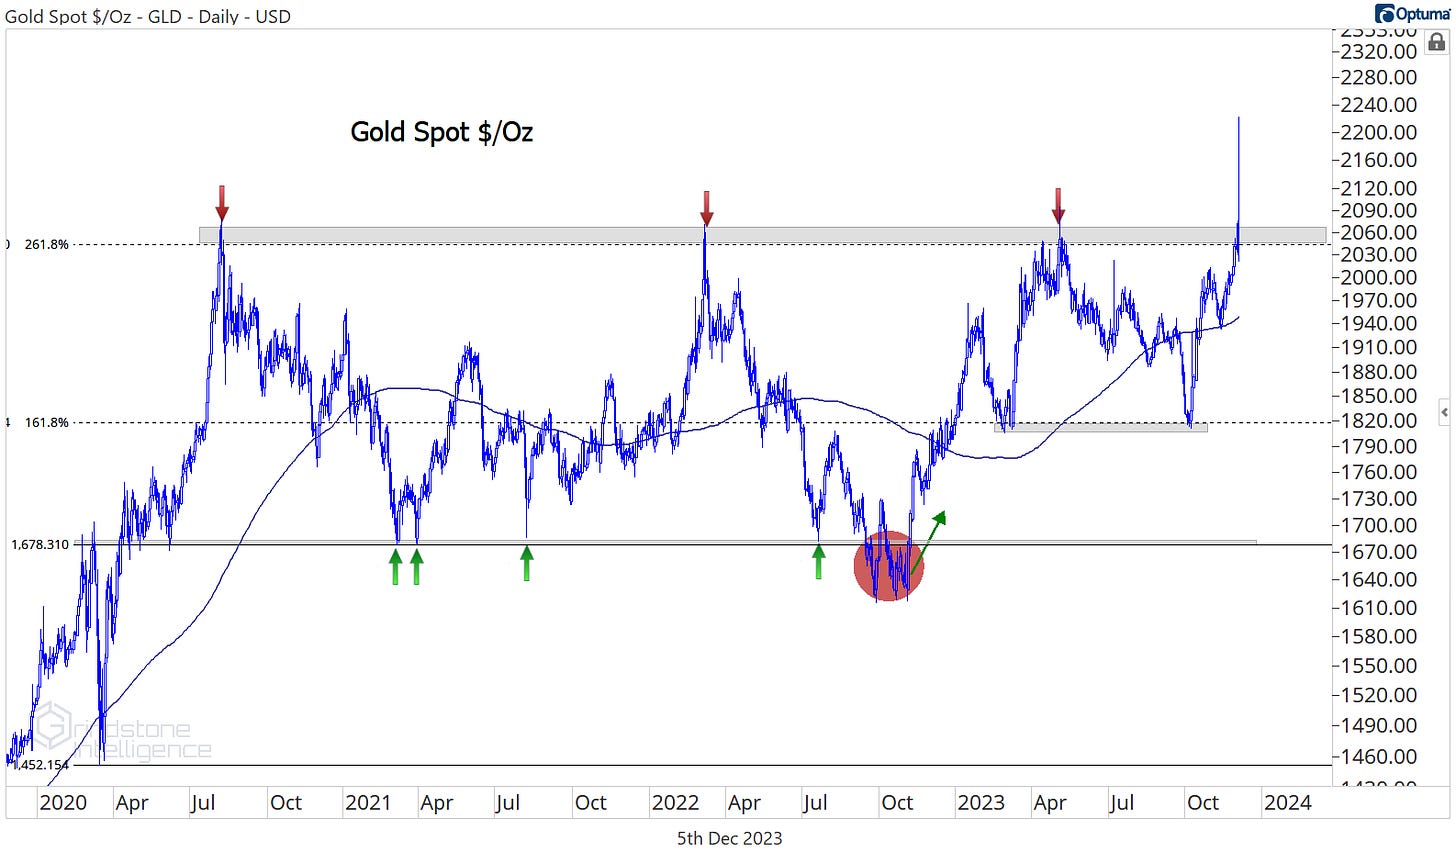
Fortunately, stocks aren’t the only place to make money these days. Gold briefly touched new 52-week highs over the weekend, after more than 3 years of going nowhere.
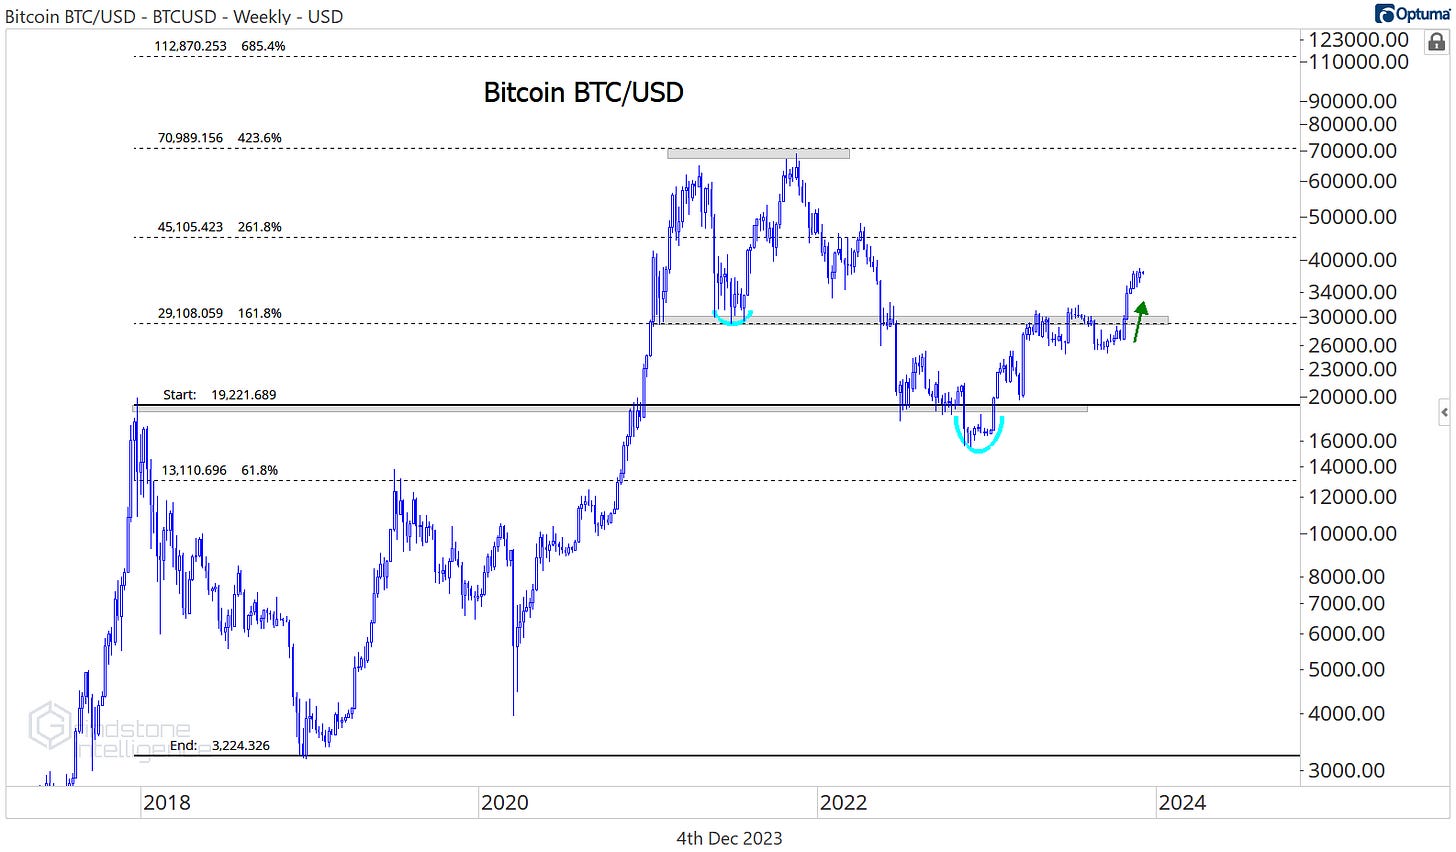
And Bitcoin has been surging since breaking out above 30000 in late October.
We discussed our outlook and targets for both last week. In any case, whether it’s stocks, precious metals, or crypto, asset prices are on the rise. We’d much rather be looking for things to buy than things to sell.
That’s all for today. Until next time.


