It's All About the Tech Sector
Top charts and trade ideas from Information Technology
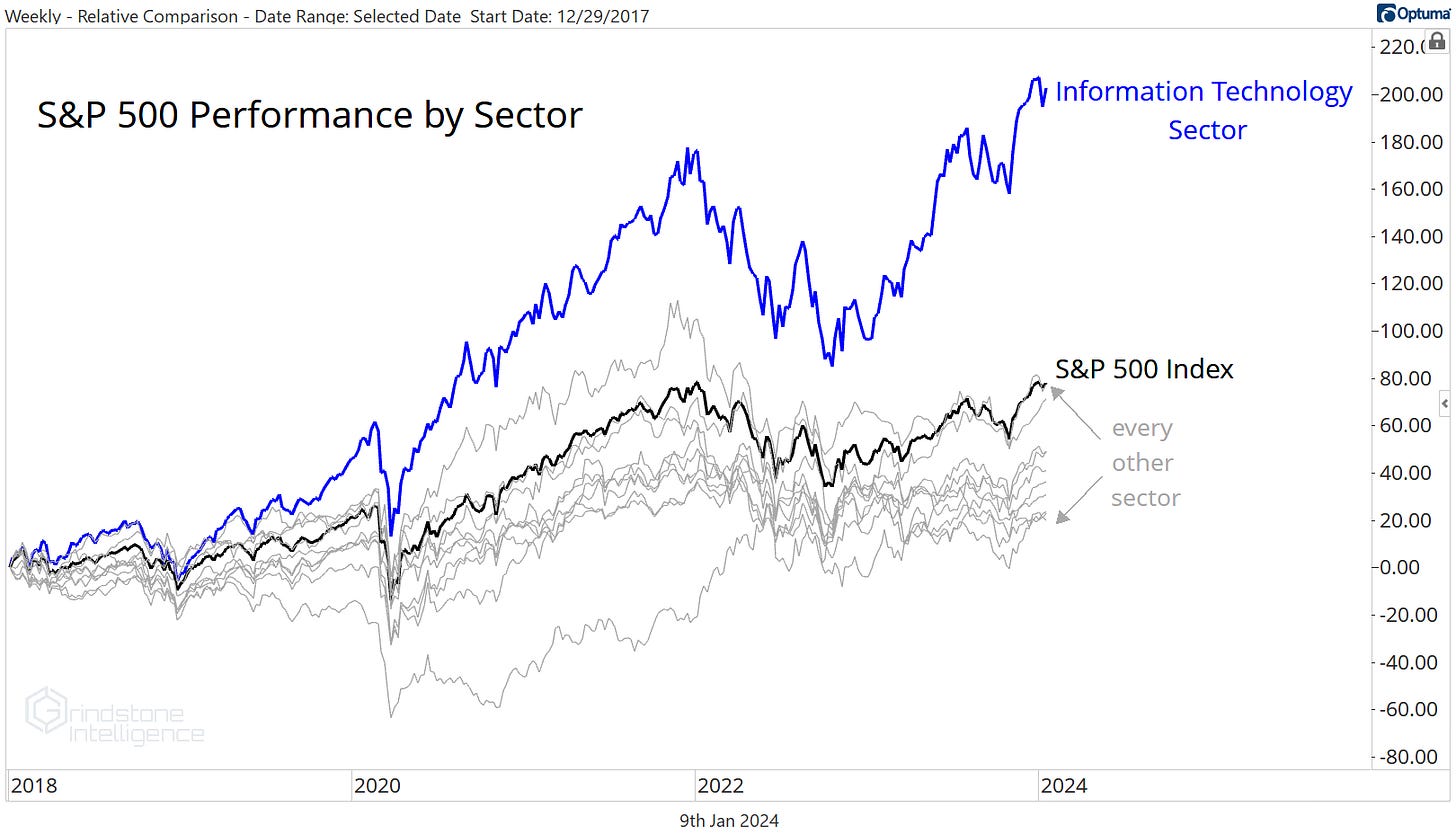
Has there ever been a run like the one we’ve seen for Tech over the last 6 years? Since the end of 2017, 10 of the 11 sectors that make up the S&P 500 have been below ‘average’.
How’s that possible? The index’s largest sector, Information Technology, has been so dominant over the period that it’s dragged the entire index higher. Tech is up a whopping 200%, the S&P 500 has risen 78%, and every other sector has lagged the benchmark. For 6 years.
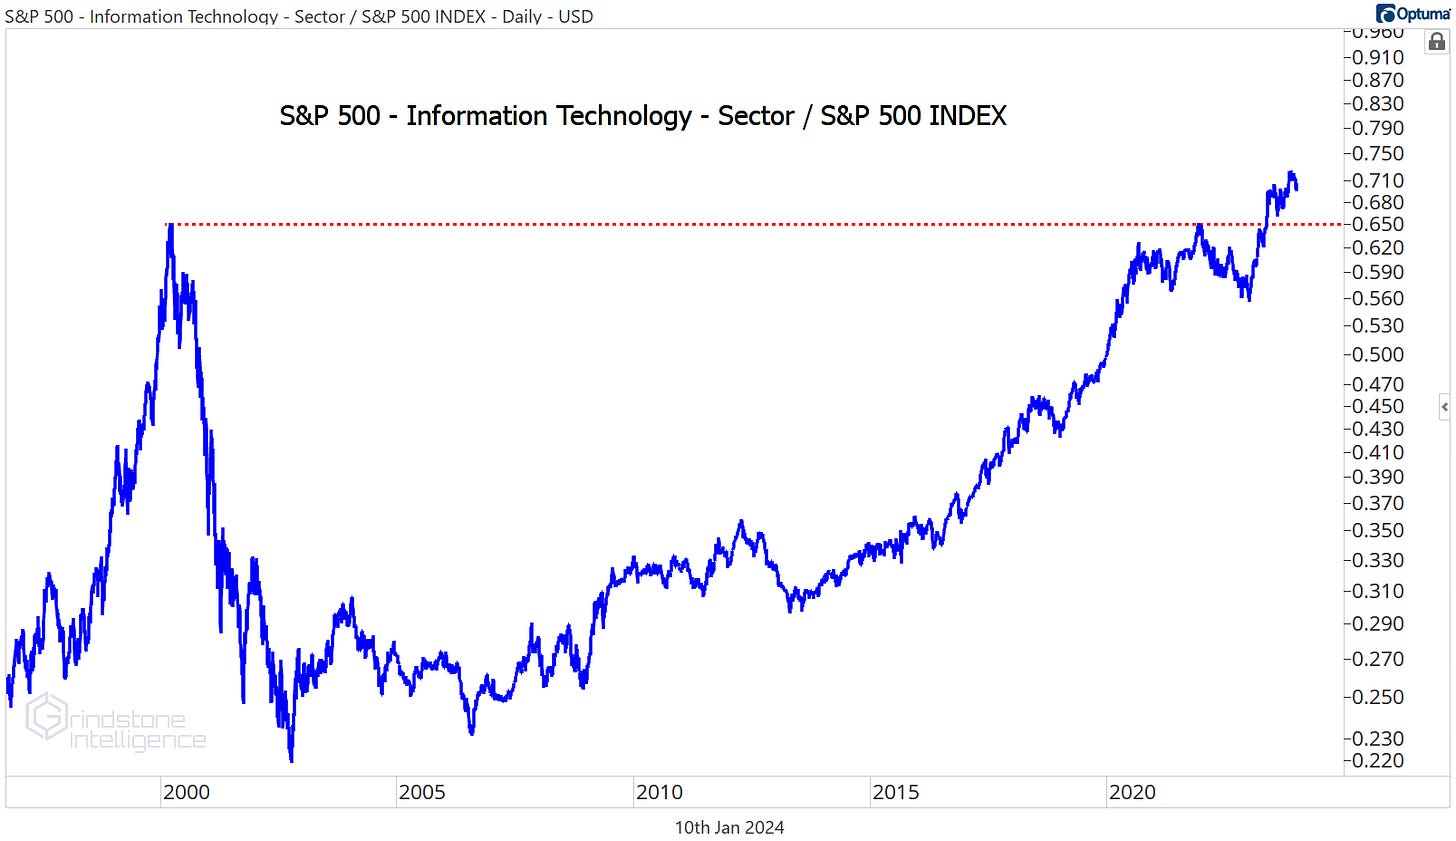
Will Tech’s dominance continue for the next 6? Who knows? But if you think Tech has gone ‘too far, too fast,’ think again. In truth, Tech just went nowhere for more than 20 years when compared to the S&P 500. Last year, the sector finally surpassed the dotcom bubble peak:
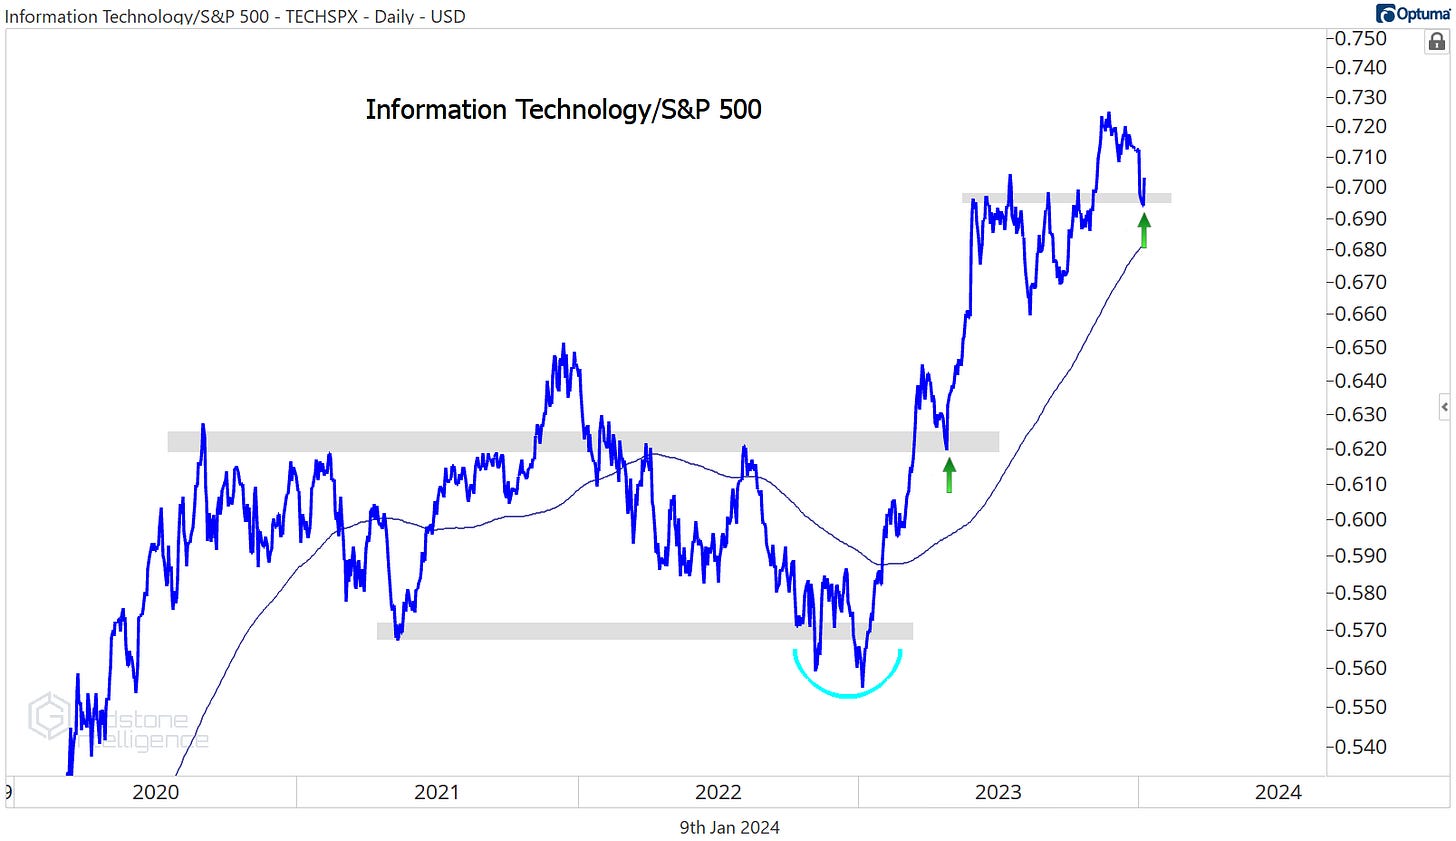
Here’s a closer look at the Information Technology Sector/S&P 500 ratio.
Since breaking out of the 2020-2022 trading range, Tech has steadily stair-stepped higher. Even after a modest pullback since mid-November, the ratio is still above a rising 200-day moving average. In short, this is an uptrend no matter how you slice it.
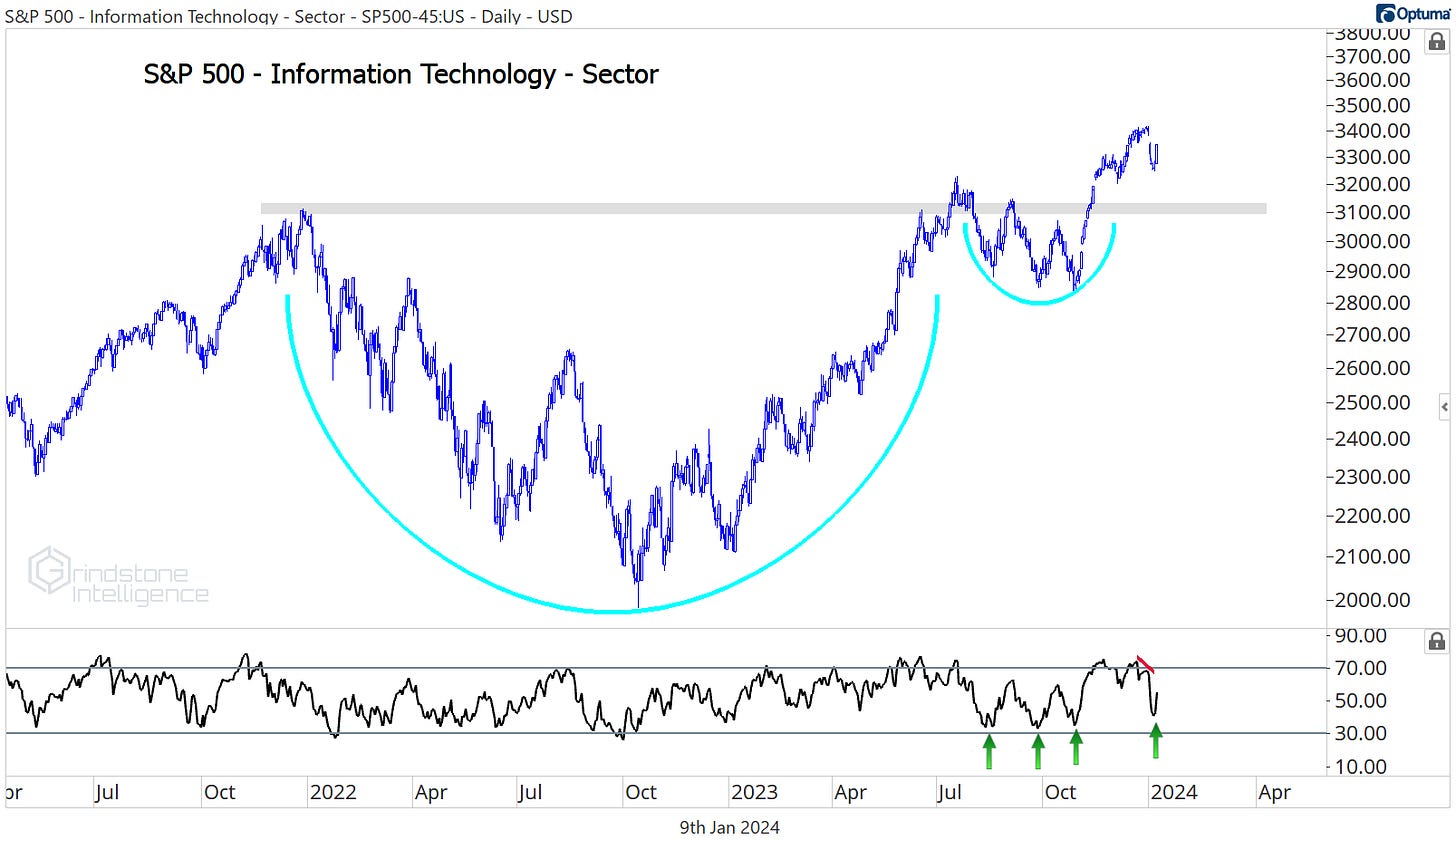
The same can be said for the sector on its own. Tech surged in the final months of 2023 to break out of a 2-year cup-and-handle base. Only a break back below those December 2021 highs would negate the long-term uptrend that’s in place.
A bearish momentum divergence at the most recent high could be trouble in the near term, but RSI hasn’t fallen into oversold territory in more than a year now. That’s clear evidence that the bulls are still in control.
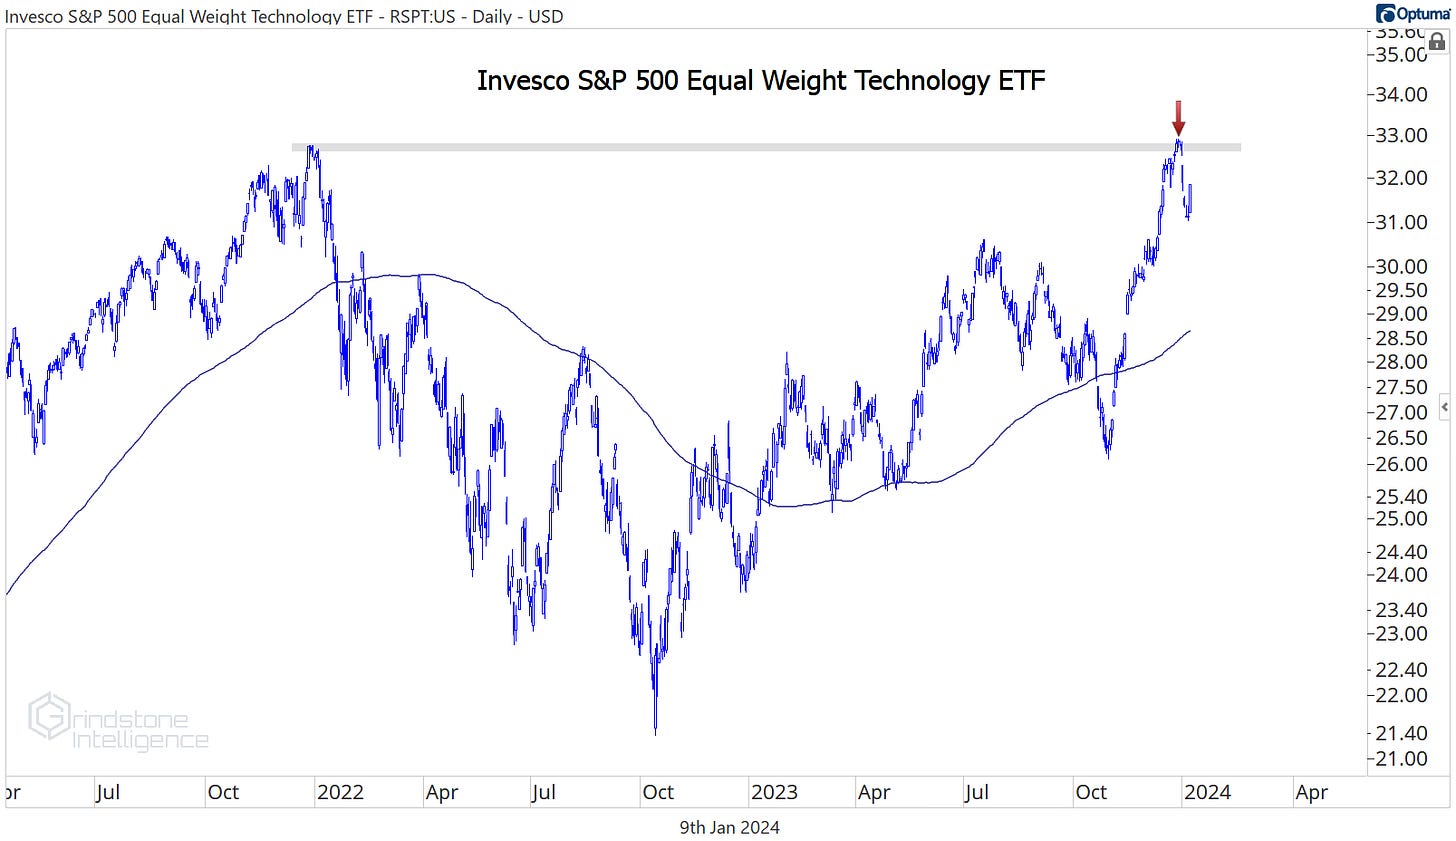
One place we haven’t yet seen confirmation is in the equally weighted sector. Equal weight Tech is still stuck below those 2021 highs:
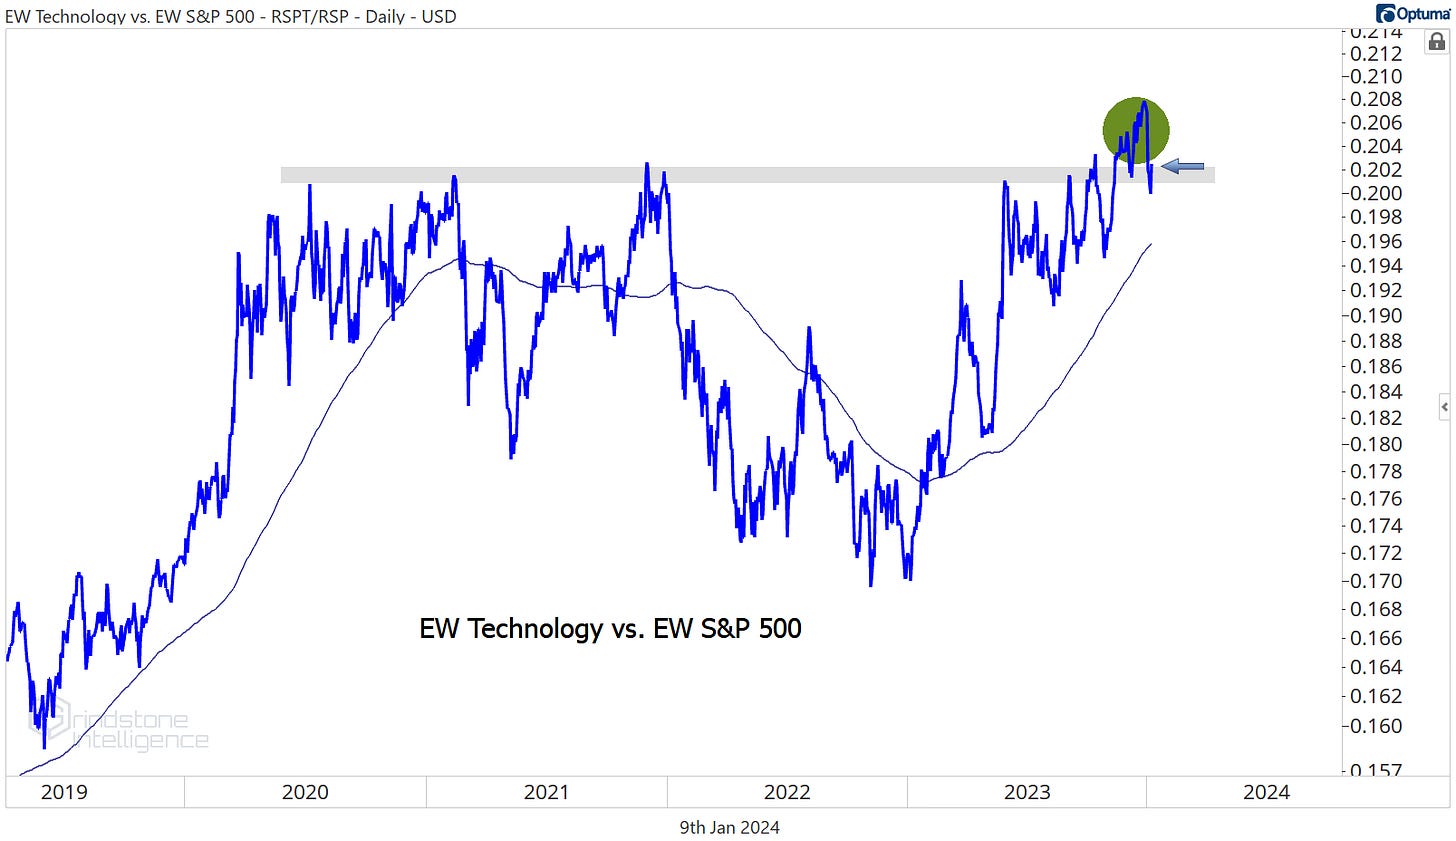
But is it fair to complain about one variation of Tech not setting new highs ‘yet’ when the S&P 500 itself hasn’t set new highs either? The EW sector is still an outperformer. It just broke out of a 3-year base compared to the equally weighted benchmark index:
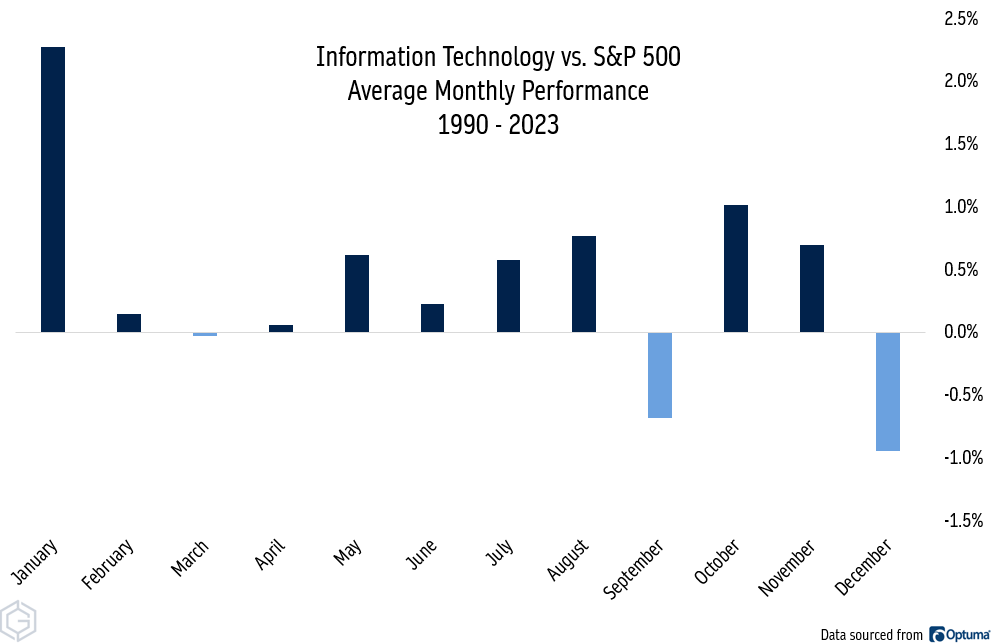
Whether that breakout can hold is the question for January. From failed moves come fast moves in the opposite direction, and a potential reversal at this level is the best thing that Tech bears have going for them. Especially if support is broken over the next 3 weeks. Historically, January is the single best month for Tech stocks. Since 1990, the sector has outperformed the S&P 500 by an average of 2.3% in January.
If Tech doesn’t maintain its leadership in the best month for the sector, what would that mean for the next three months, which are among the weakest for Tech? Stay tuned.
Digging Deeper
What’s old is new again.
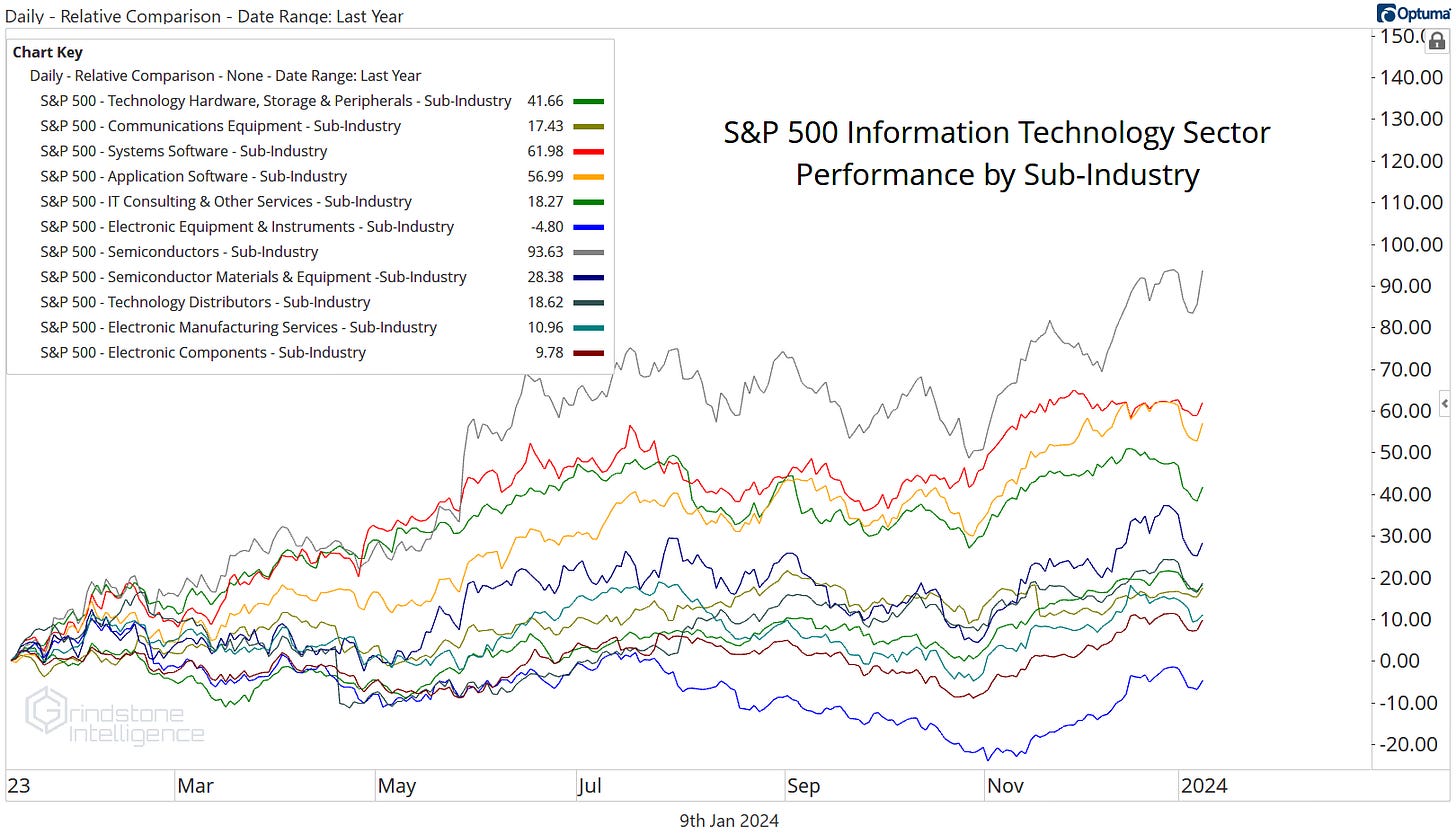
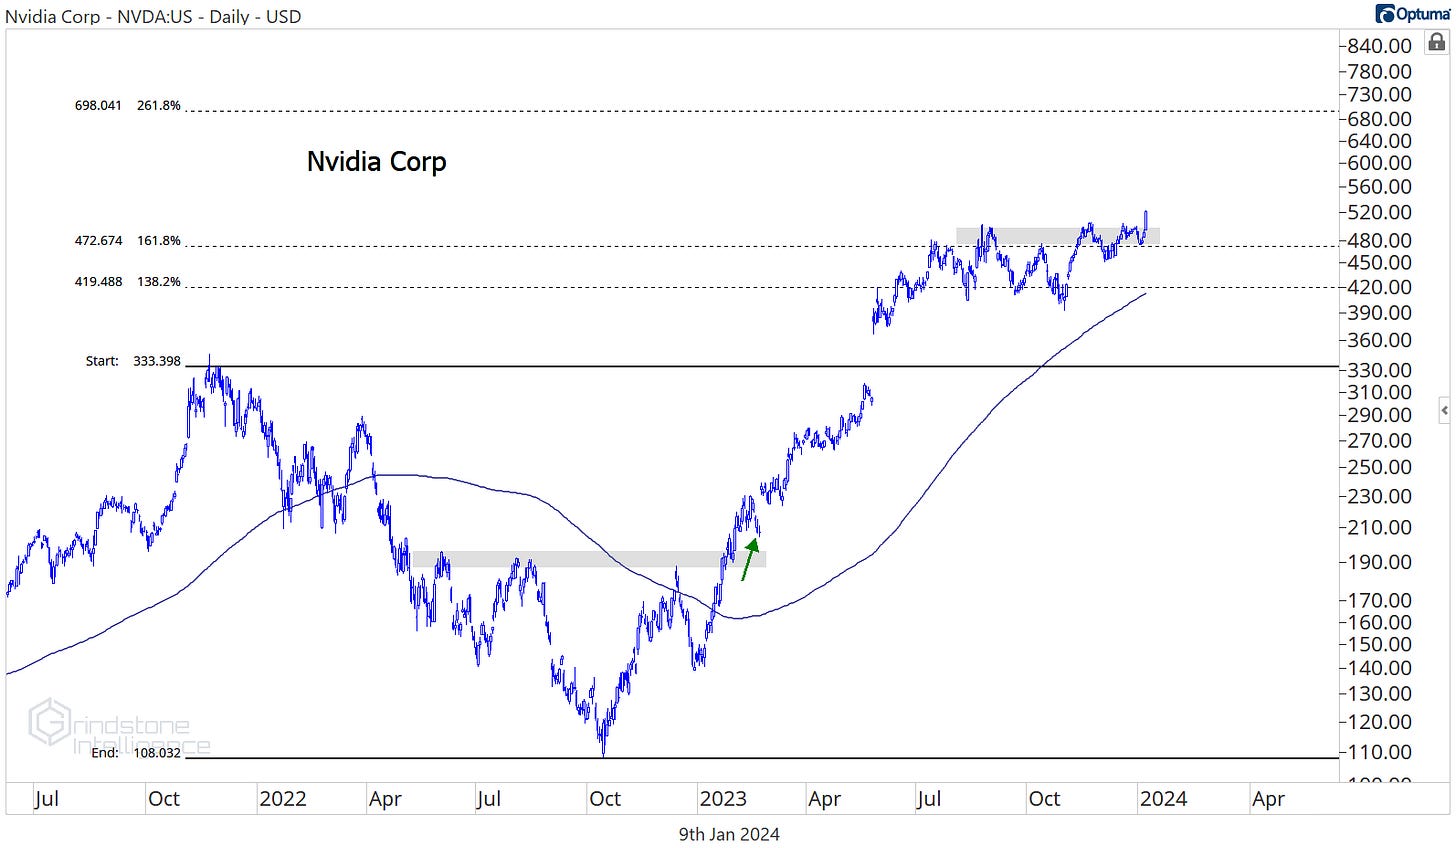
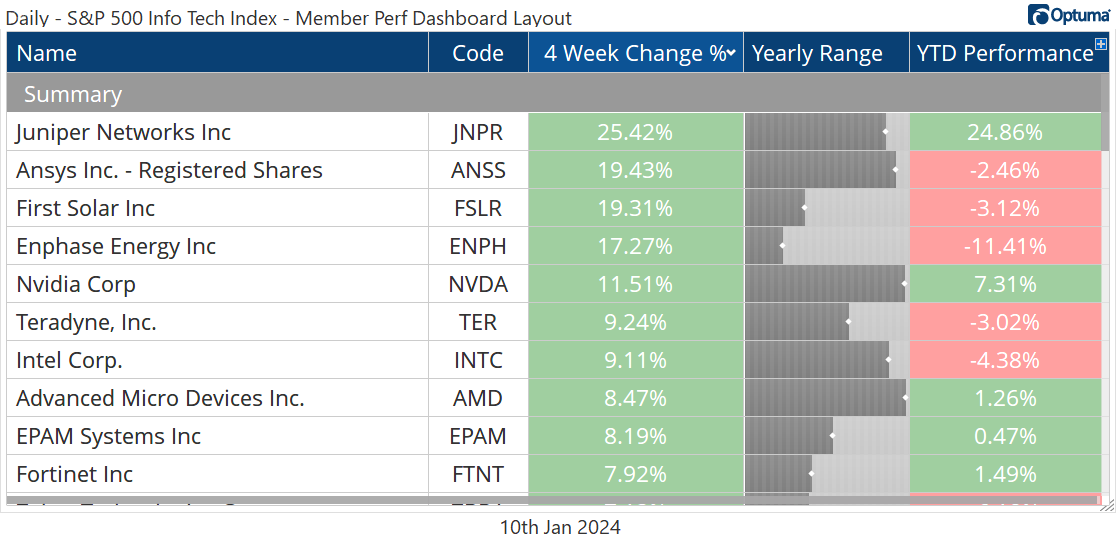
Semiconductors were the top performing sub-industry in 2023, thanks in large part to the huge gains by NVIDIA. The group is back to the top of the leaderboard to start 2024, and you can probably guess why. NVDA is already up 7% for the year, and within the Tech sector, only Juniper Networks’ takeover-fueled 25% rally has been larger.
We’ve wanted to own NVDA above $470, which is the 161.8% retracement from the 2021-2022 decline, and Monday’s breakout to new highs only strengthens the outlook. We think the stock can go to the next key Fibonacci retracement level, which is near $700.
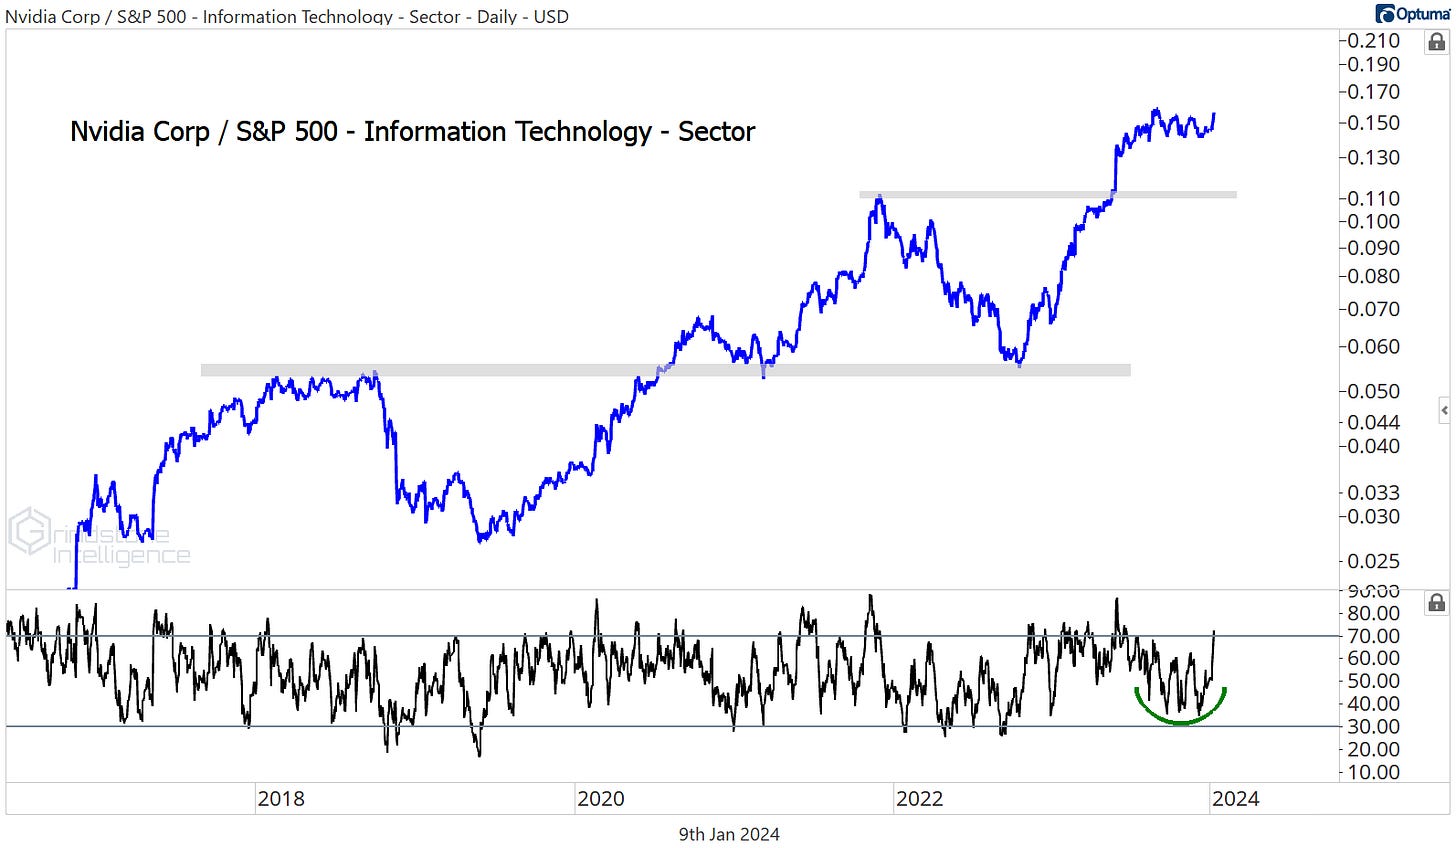
The relative strength in the stock really stands out. Here it is compared to the rest of the Tech sector (which itself is showing relative strength against the S&P 500). The NVDA/Tech ratio is knocking on the door of new all time highs and momentum is in a bullish range. There’s no reason to bet against this one.
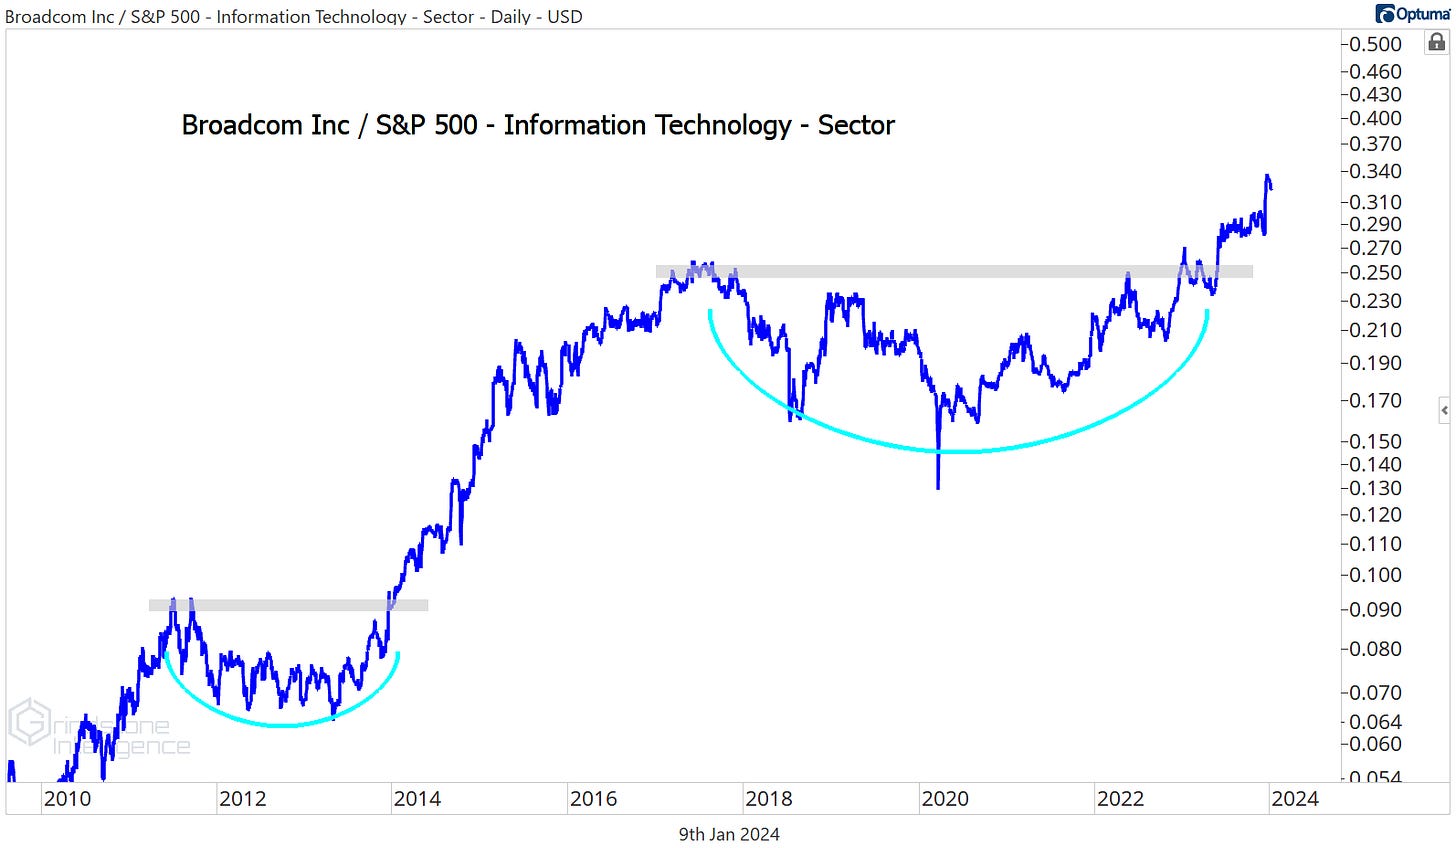
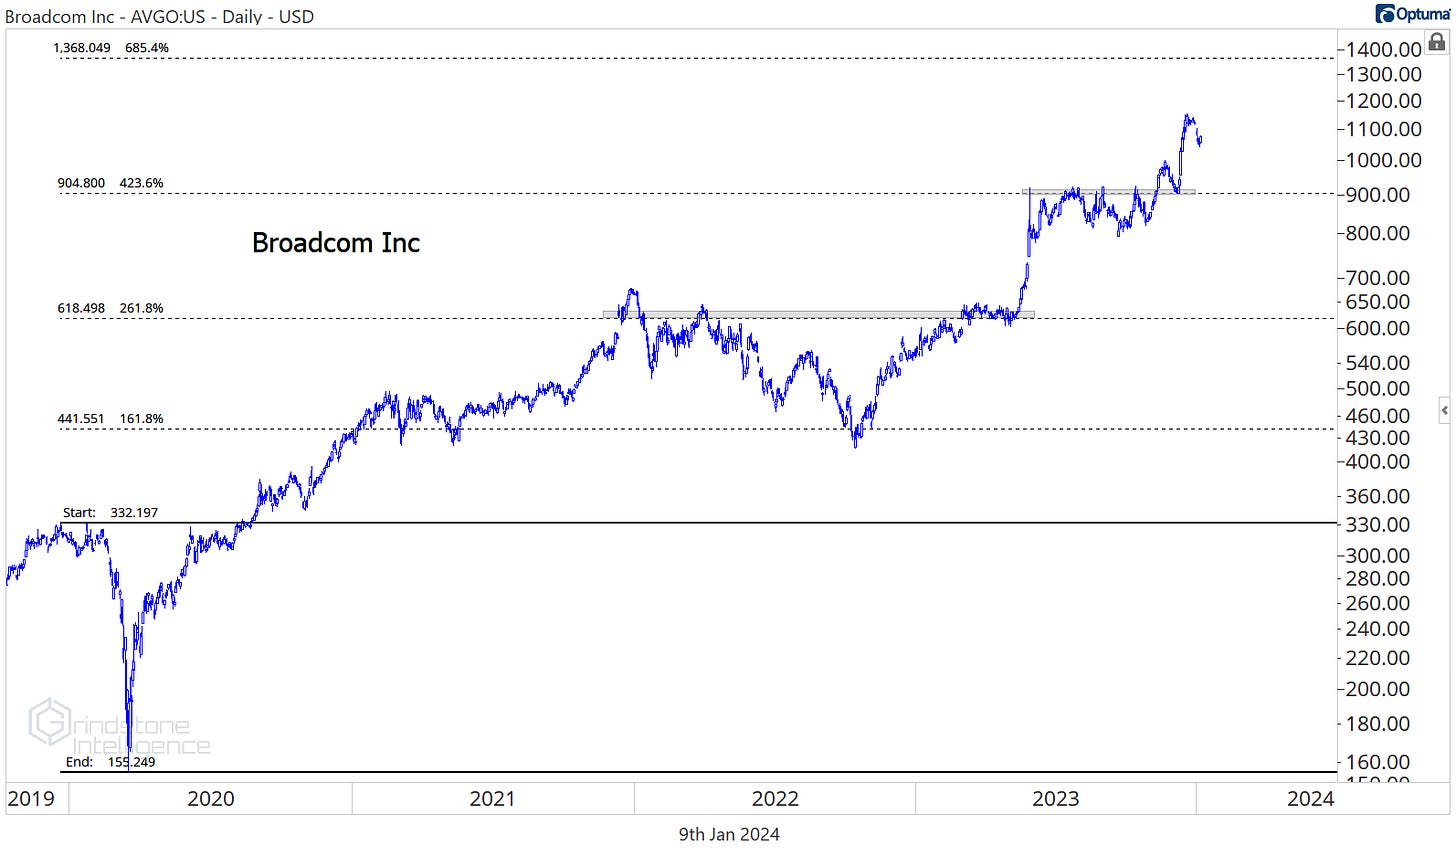
Elsewhere within the semiconductor space, we still really like Broadcom. It’s already setting new relative highs against the rest of Tech.
Our target is $1360, which is the 685.4% retracement from the 2019-2020 decline.
Leaders
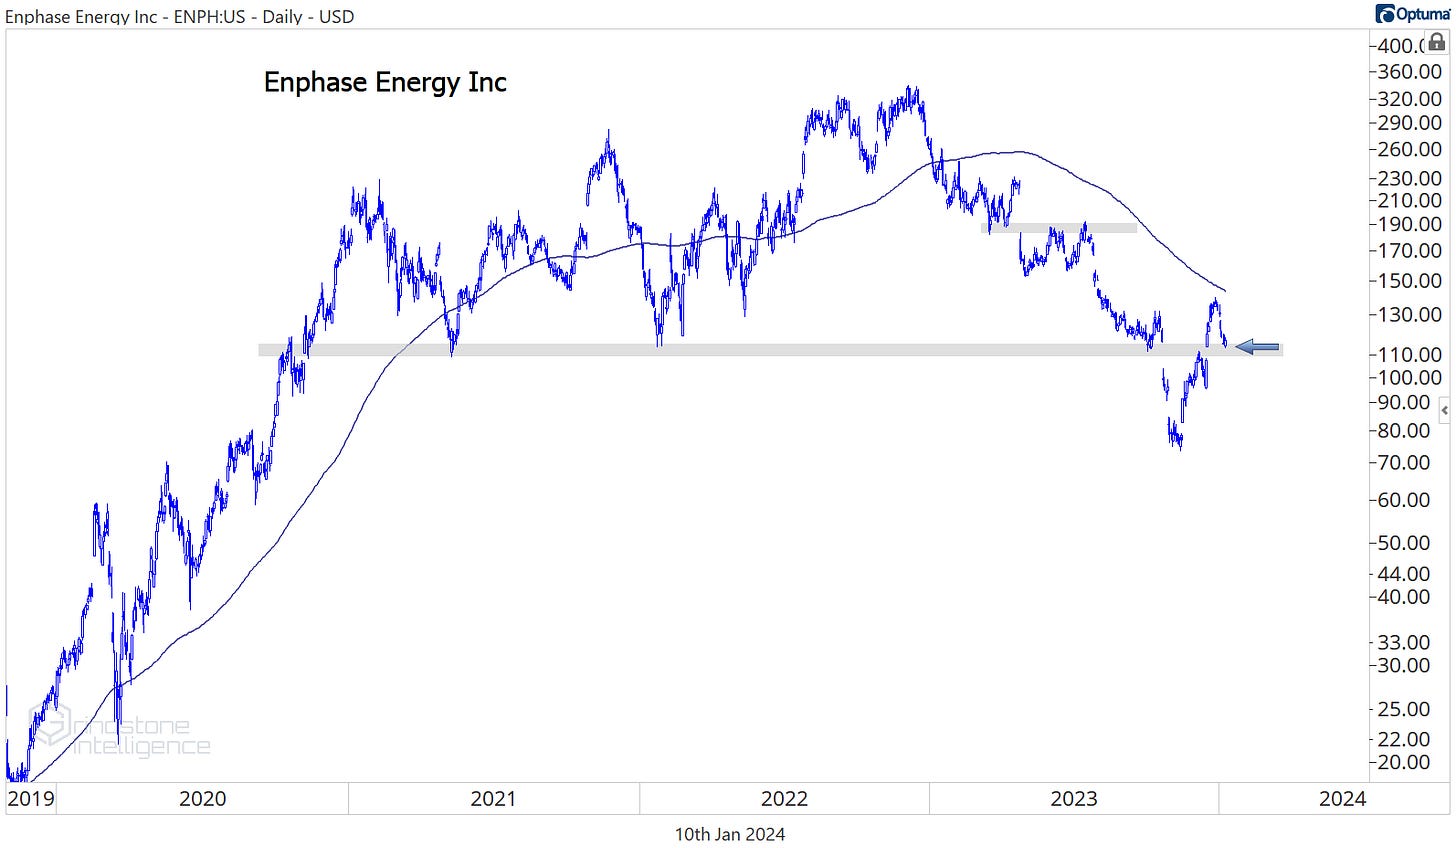
Juniper Networks and Ansys were the two best stocks in the sector over the last 4 weeks, and both benefited from takeover announcements. Enphase Energy rallied almost as much, jumping 17% to get back above the 2021-2022 lows. The level to watch for ENPH is $110. If the stock is above that, we can approach it from the long side with a target of $190, which was a key rotational area last summer.
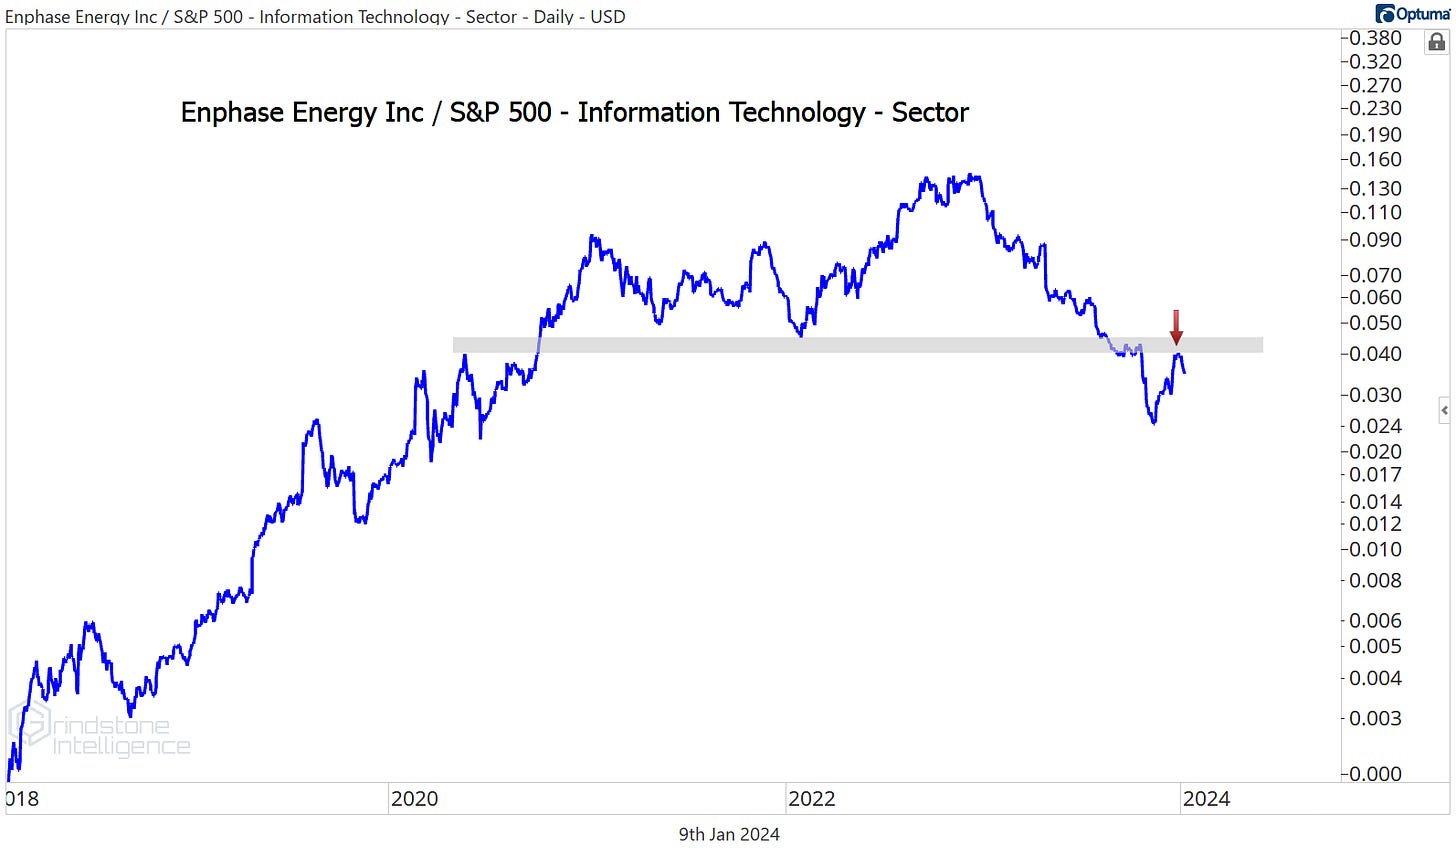
If we’re below $110, though, ENPH is one to avoid. Especially since it hasn’t shown signs of a reversal on a relative basis. Compared to the rest of Tech, the stock is still below resistance from the 2022 lows.
Losers
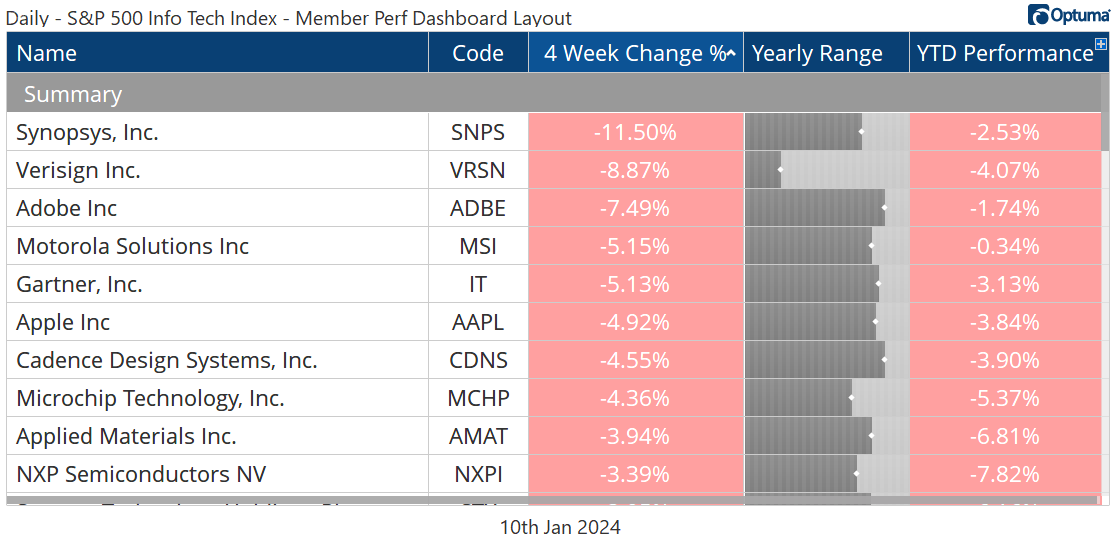
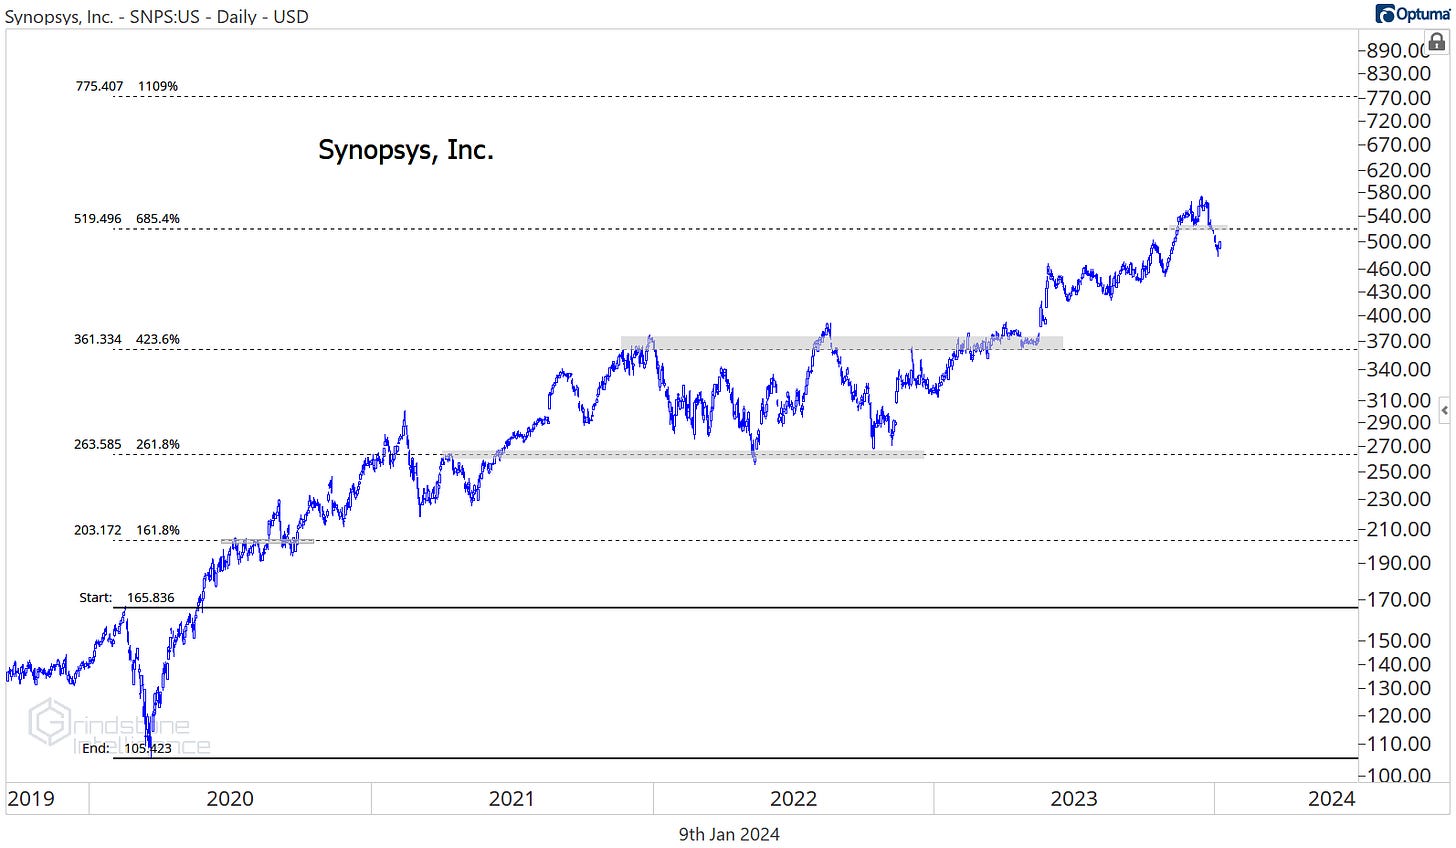
Synopsys was the worst-performing stock in the sector over the last 4 weeks, after they got punished for their planned acquisition of Ansys. With SNPS below our risk-level of $520, we’re on the sidelines for now, but if the stock can recapture that level, we want to be long with a target of $775.
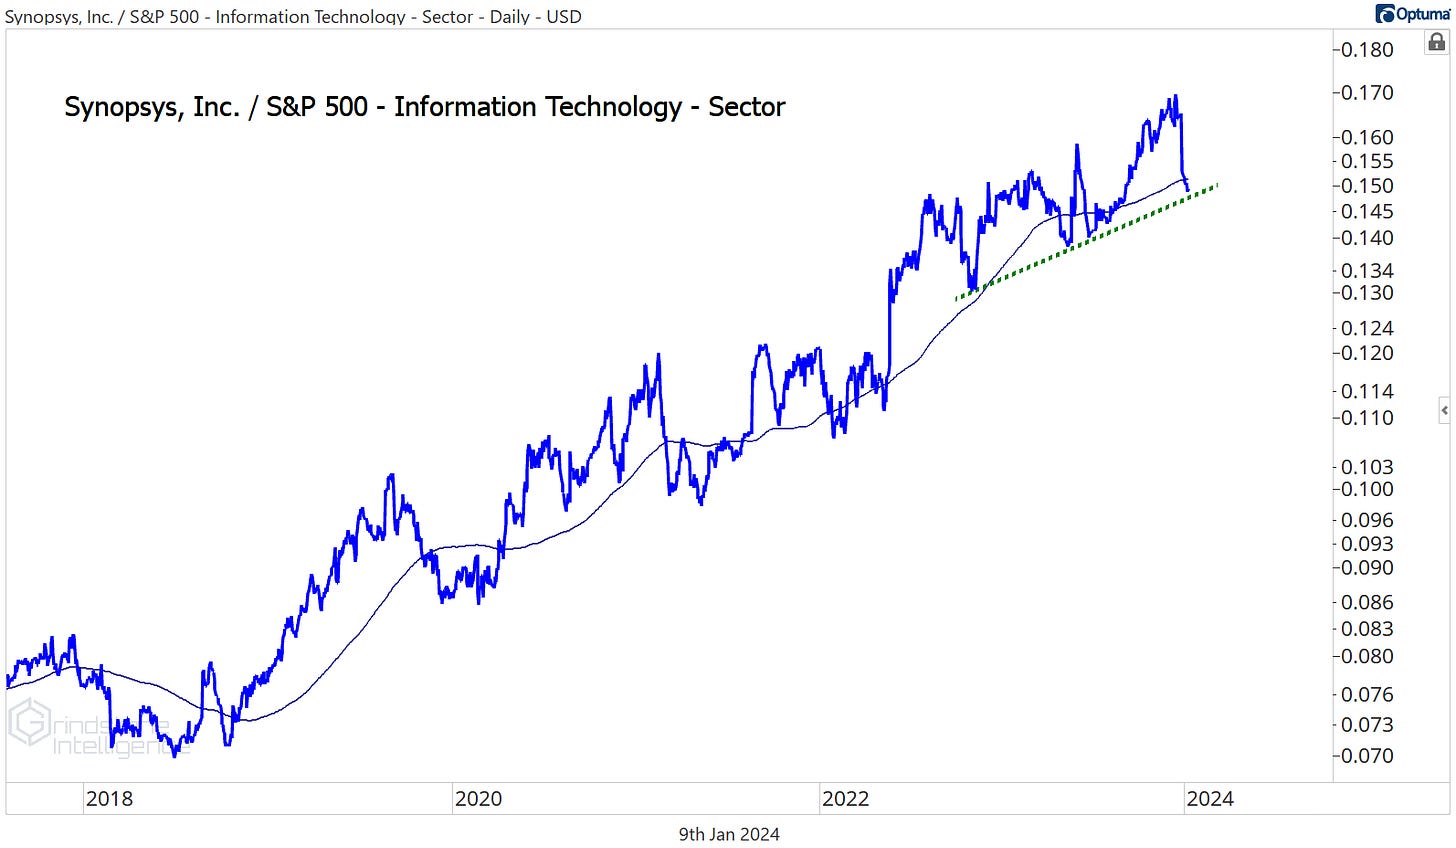
Don’t forget that Synopsys has been one of the best stocks in the world over the last 4 years, and relative strength begets relative strength. The uptrend in SNPS vs. the rest of Tech is still intact.
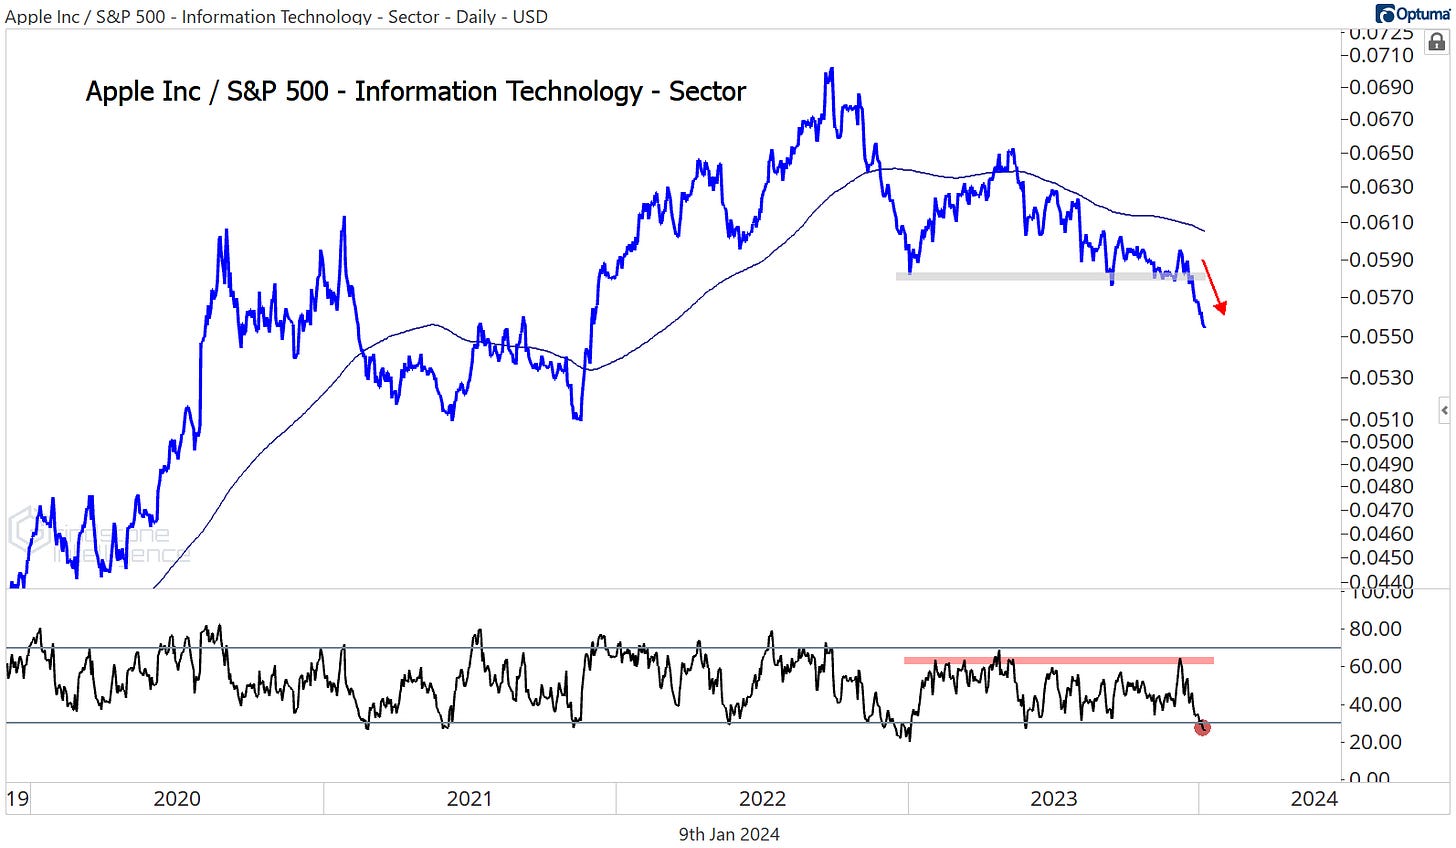
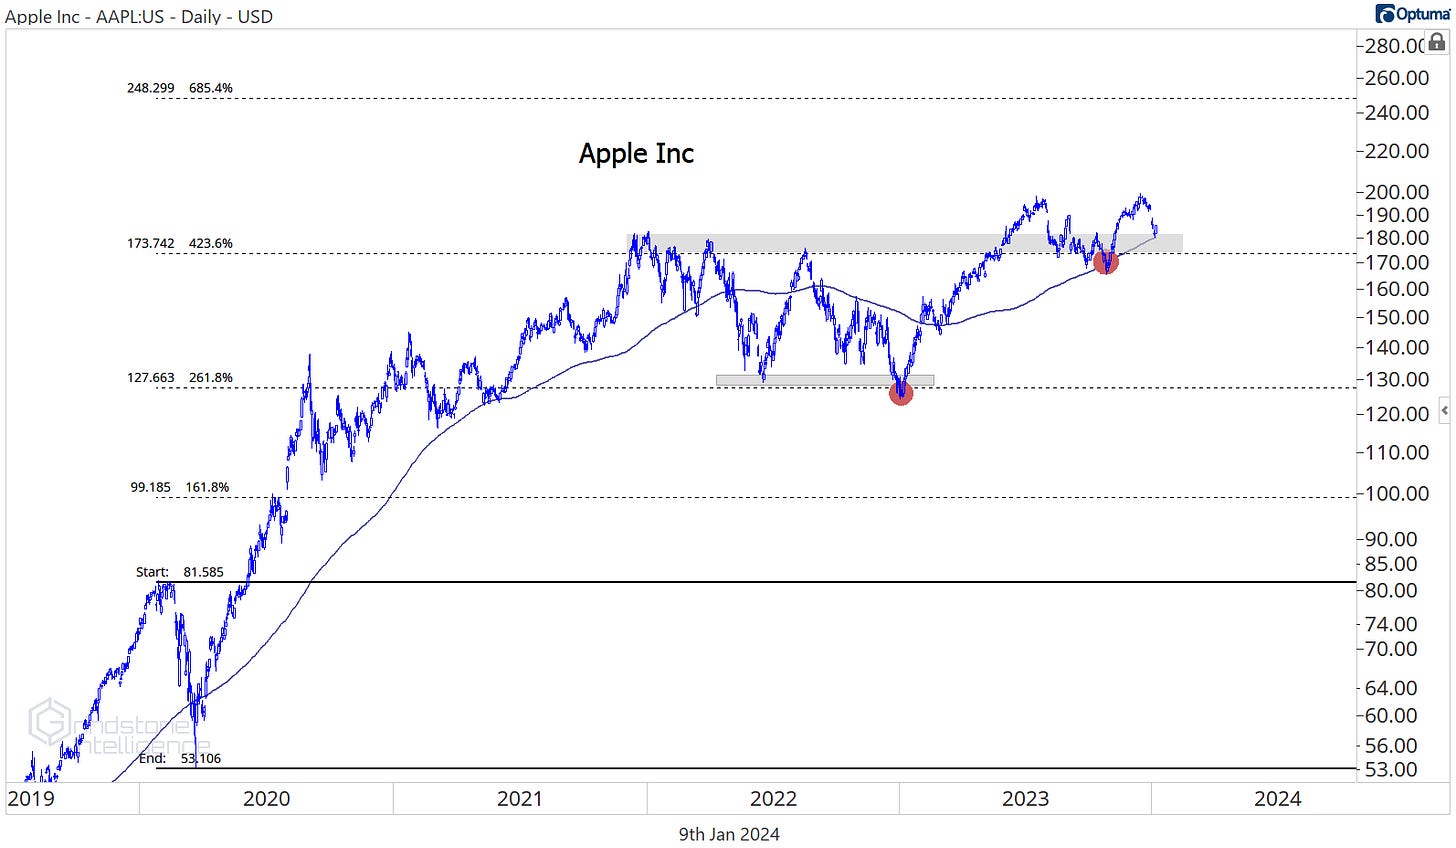
Apple was another loser over the last month, as it fell 5%. The weakness pushed Apple to multi-year relative lows vs. the rest of the Tech sector, and momentum for the AAPL/Tech ratio is in a bearish range.
Relative weakness doesn’t mean Apple has to keep falling - we still think the stock is in a structural uptrend above $170 - but for now, there are better places to focus our attention. The opportunity cost of owning laggards in a bull market is too high.
More charts to watch
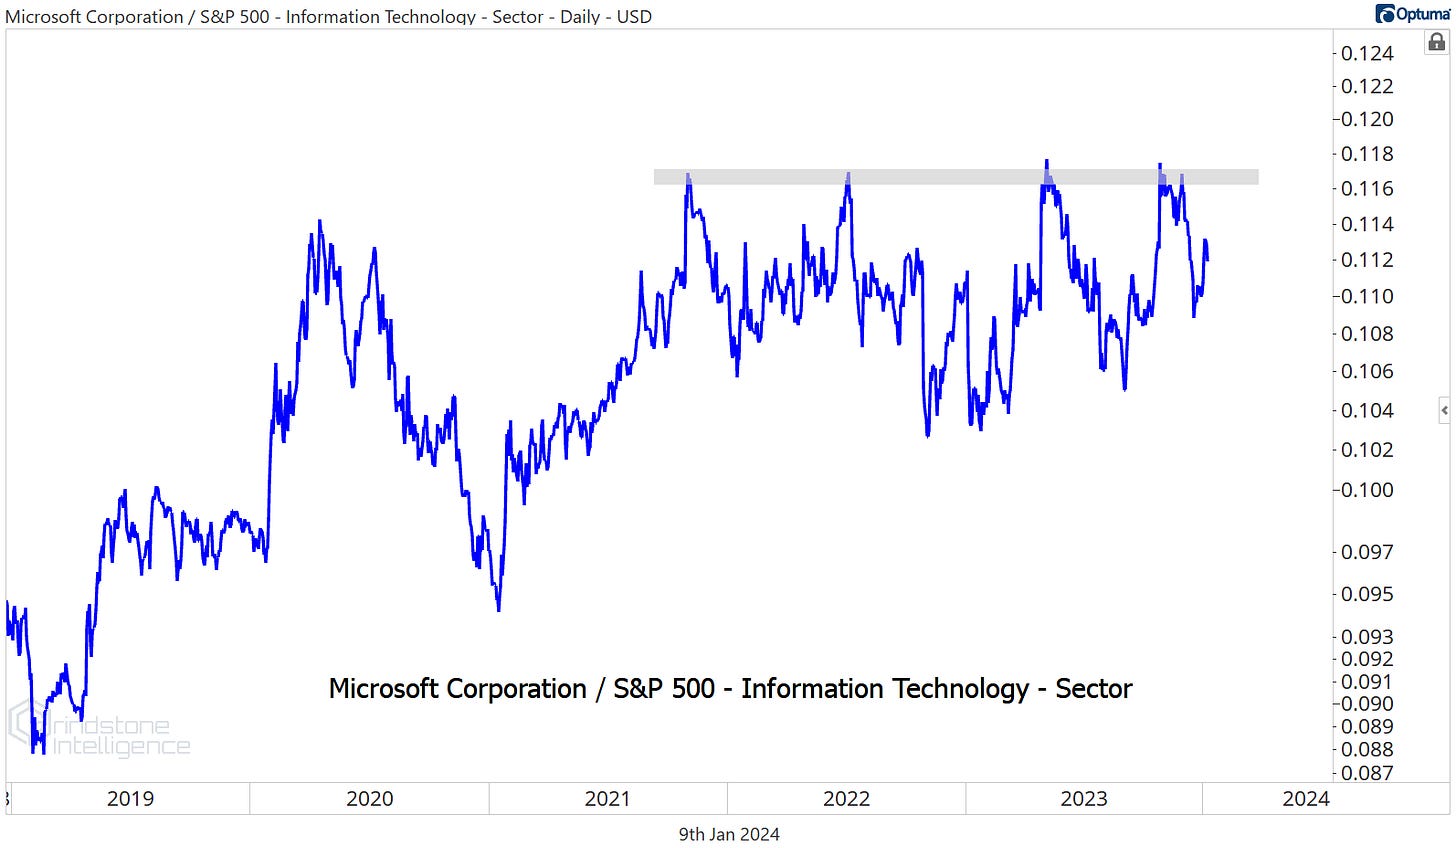
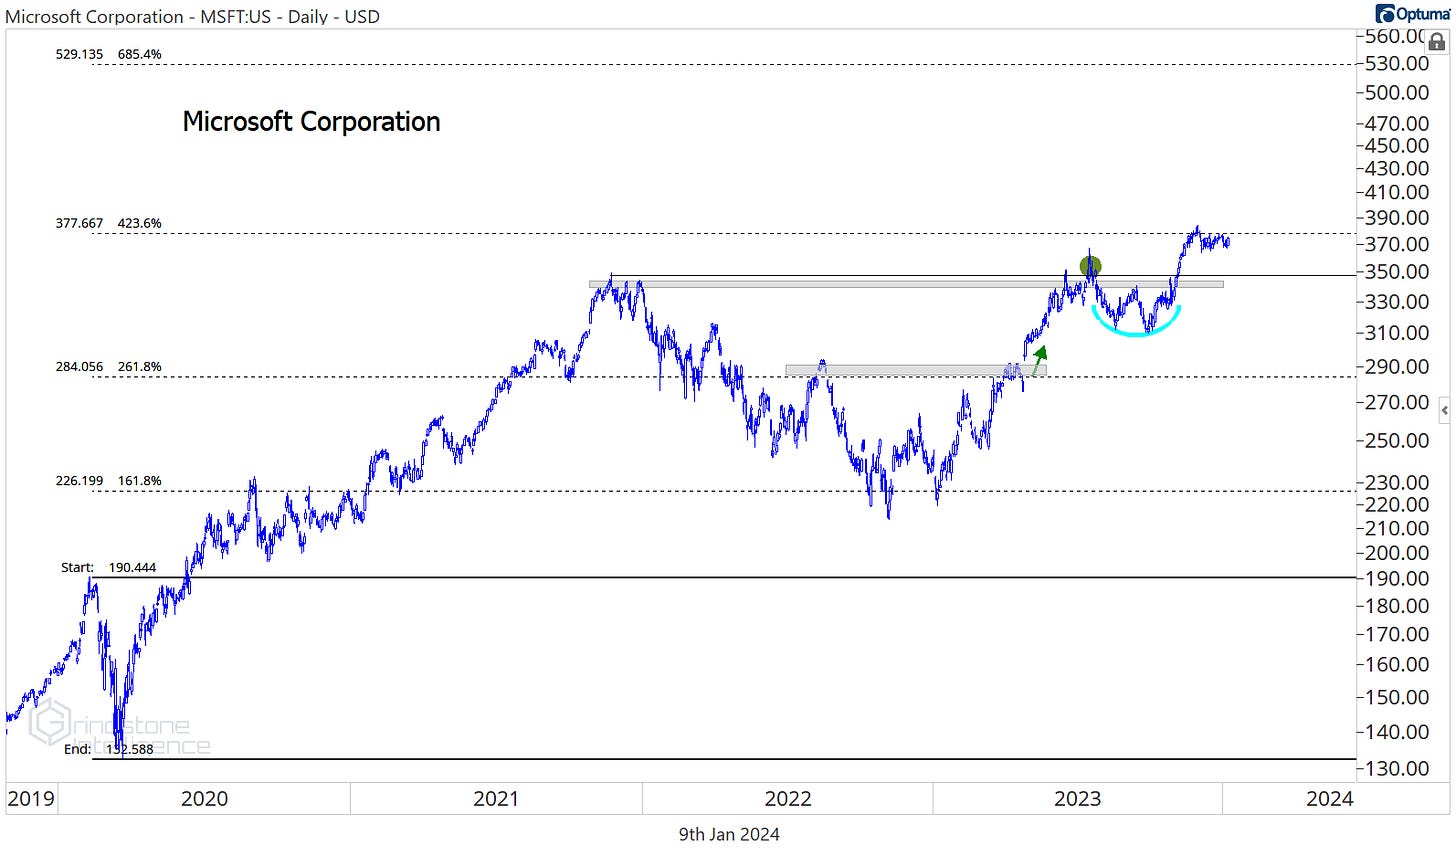
Microsoft is much the same as Apple. When compared to the rest of Tech, MSFT is stuck below overhead supply, and until that changes, there are better ways to spend our time.
A breakout to new highs could shift the narrative, though. If MSFT is above $380, we think it can go to $530, which is the 685.4% retracement from the 2020 decline.
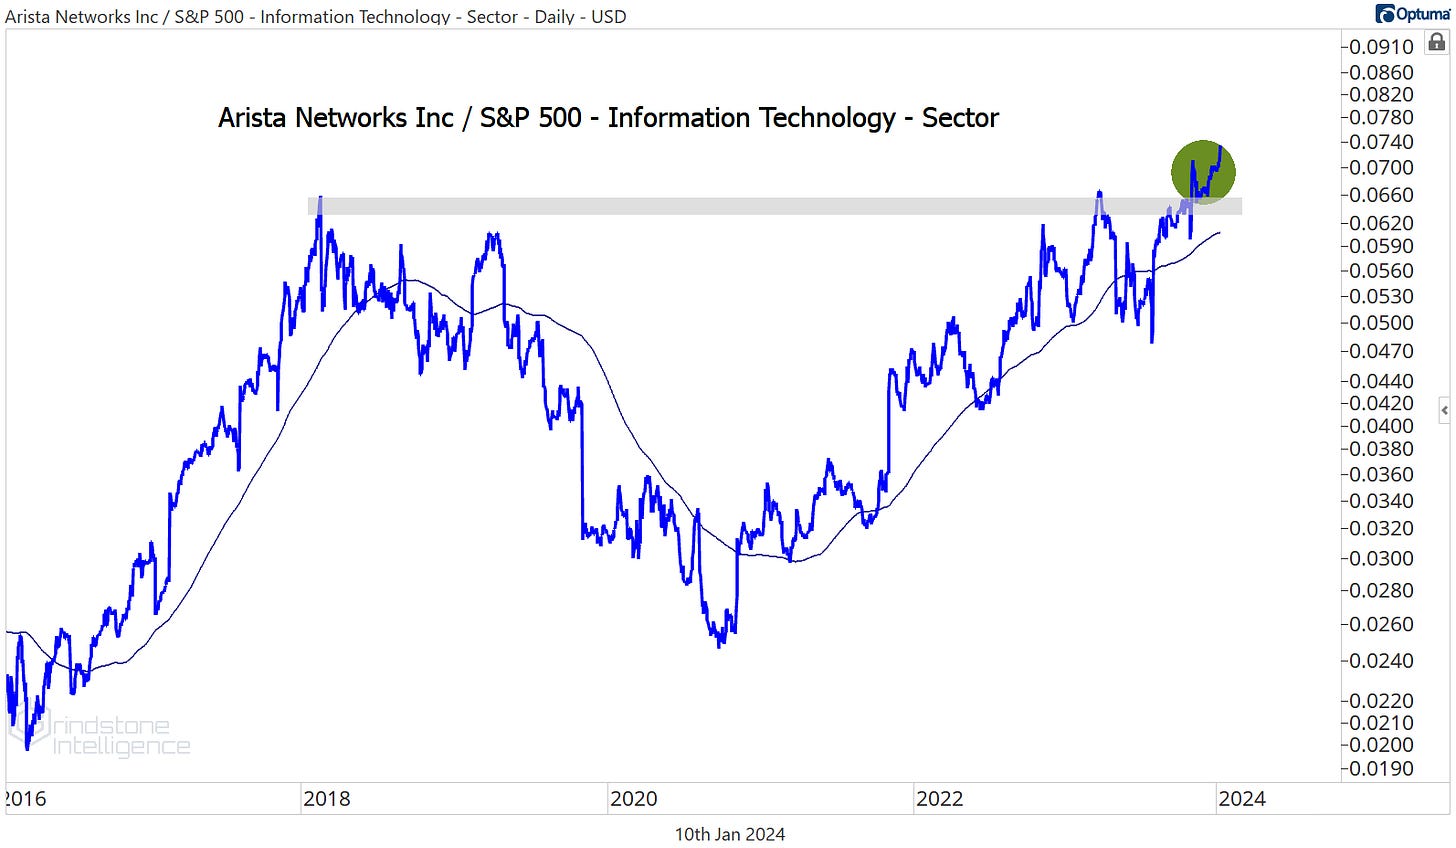
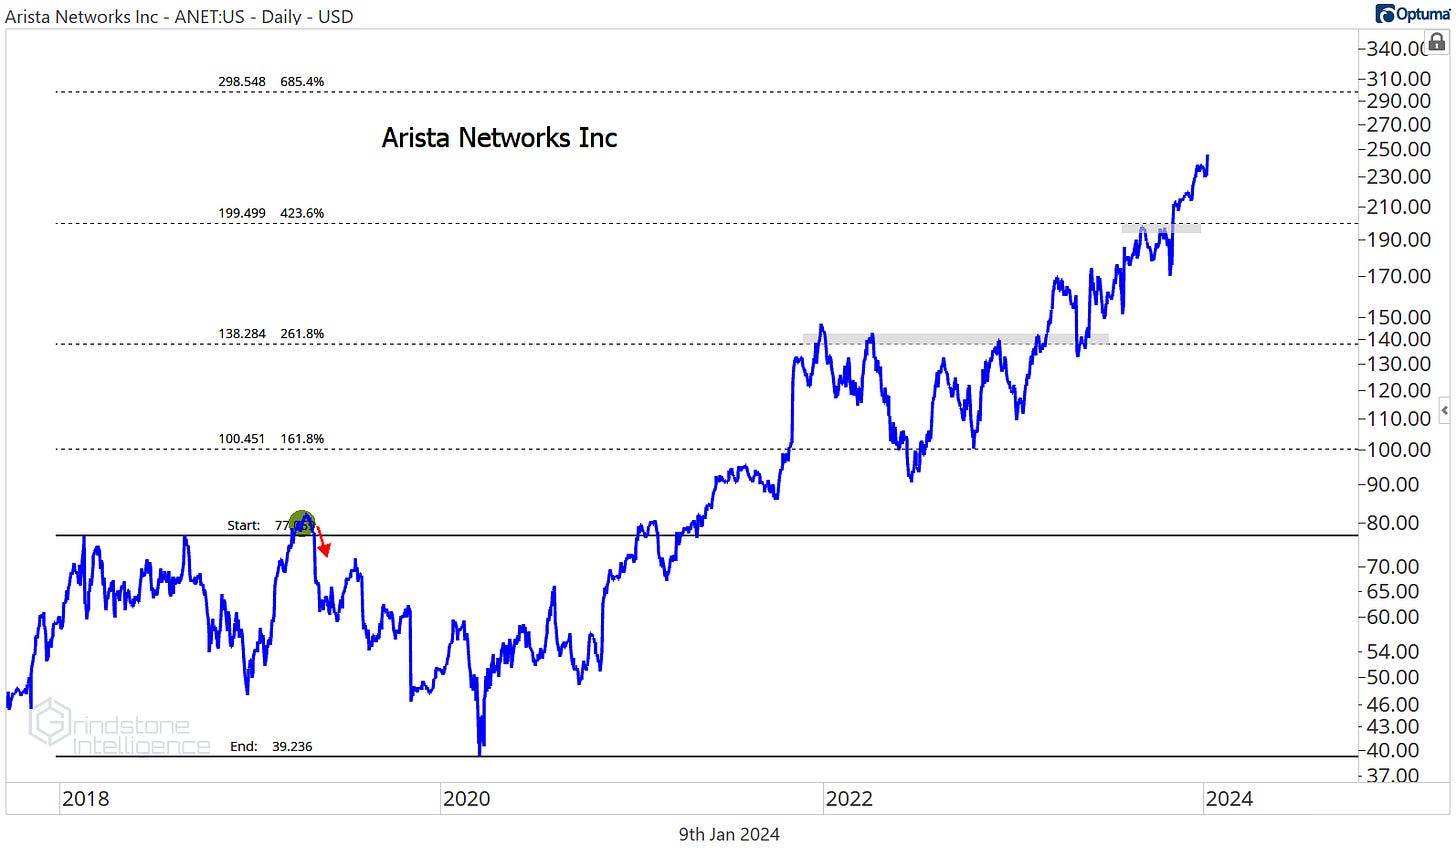
Arista Networks is setting new relative highs against the rest of Tech and we’re betting on continued outperformance.
We’re targeting $300 which is the 685.4% retracement from the 2018-2020 range, with support at the 423.6% retracement level.
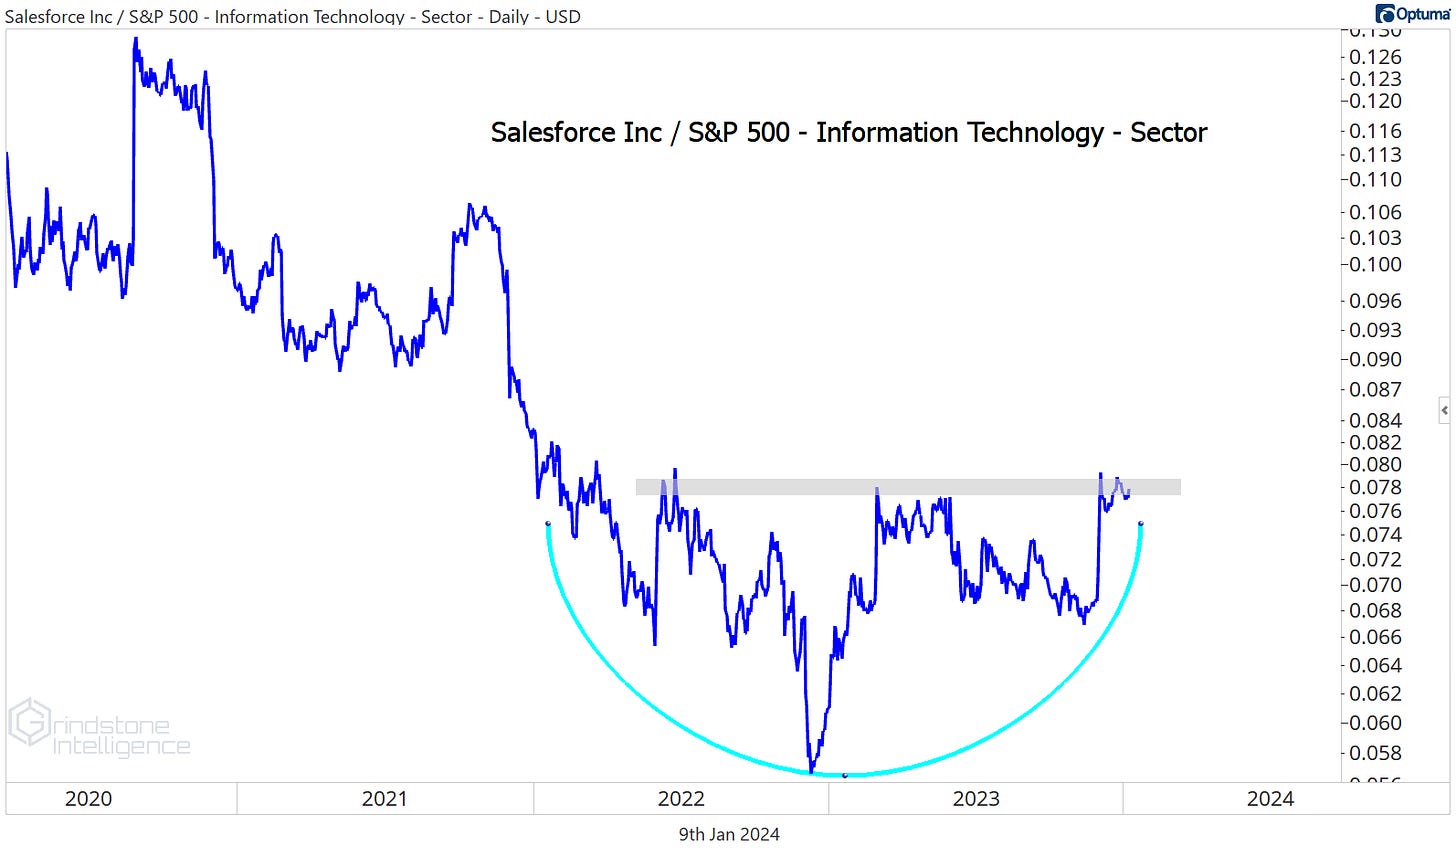
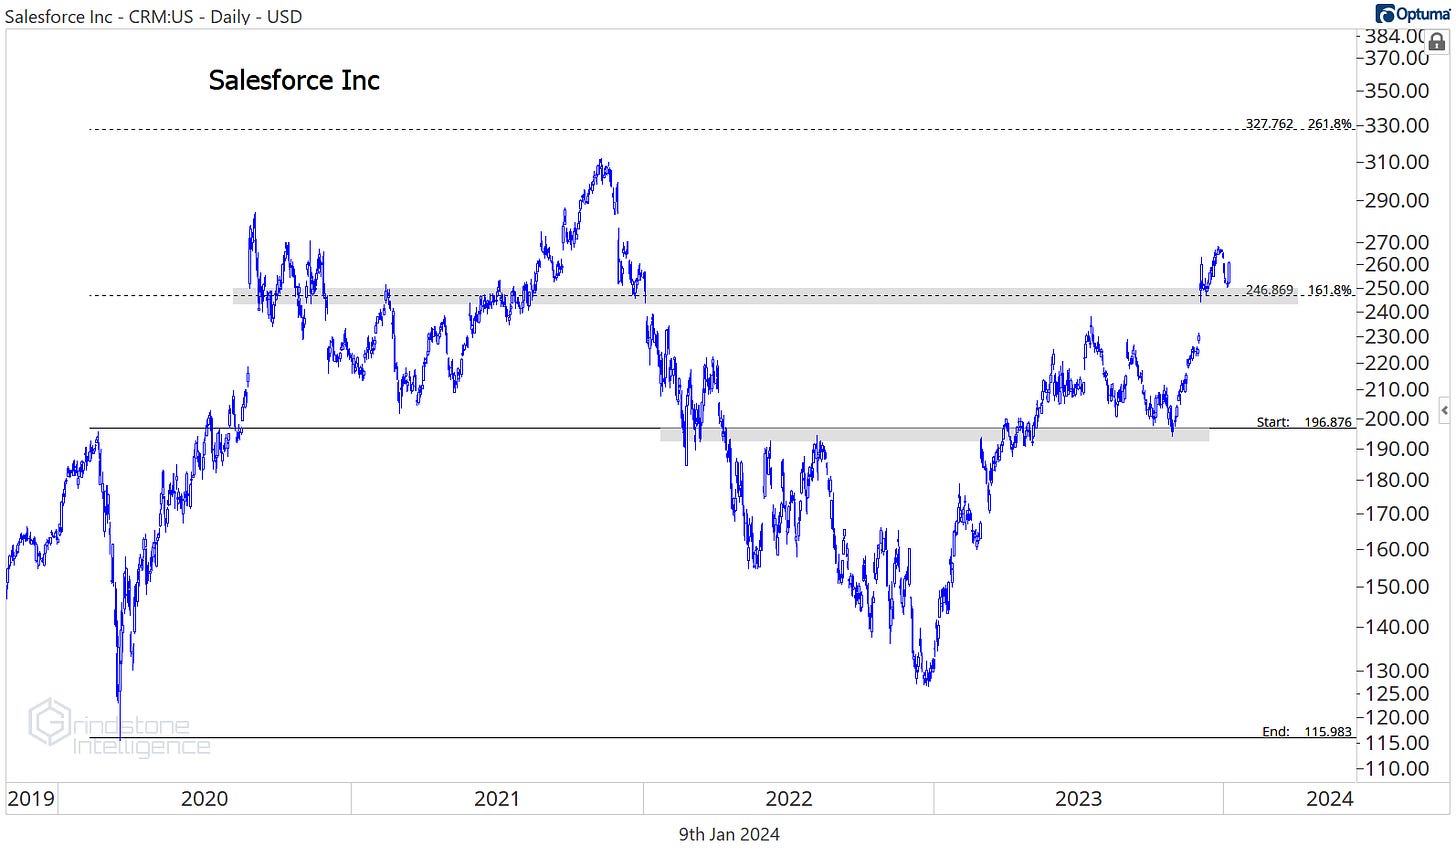
Salesforce is trying to complete a big bearish-to-bullish reversal pattern vs. the rest of Tech.
We like CRM above $250 with a target of $330.
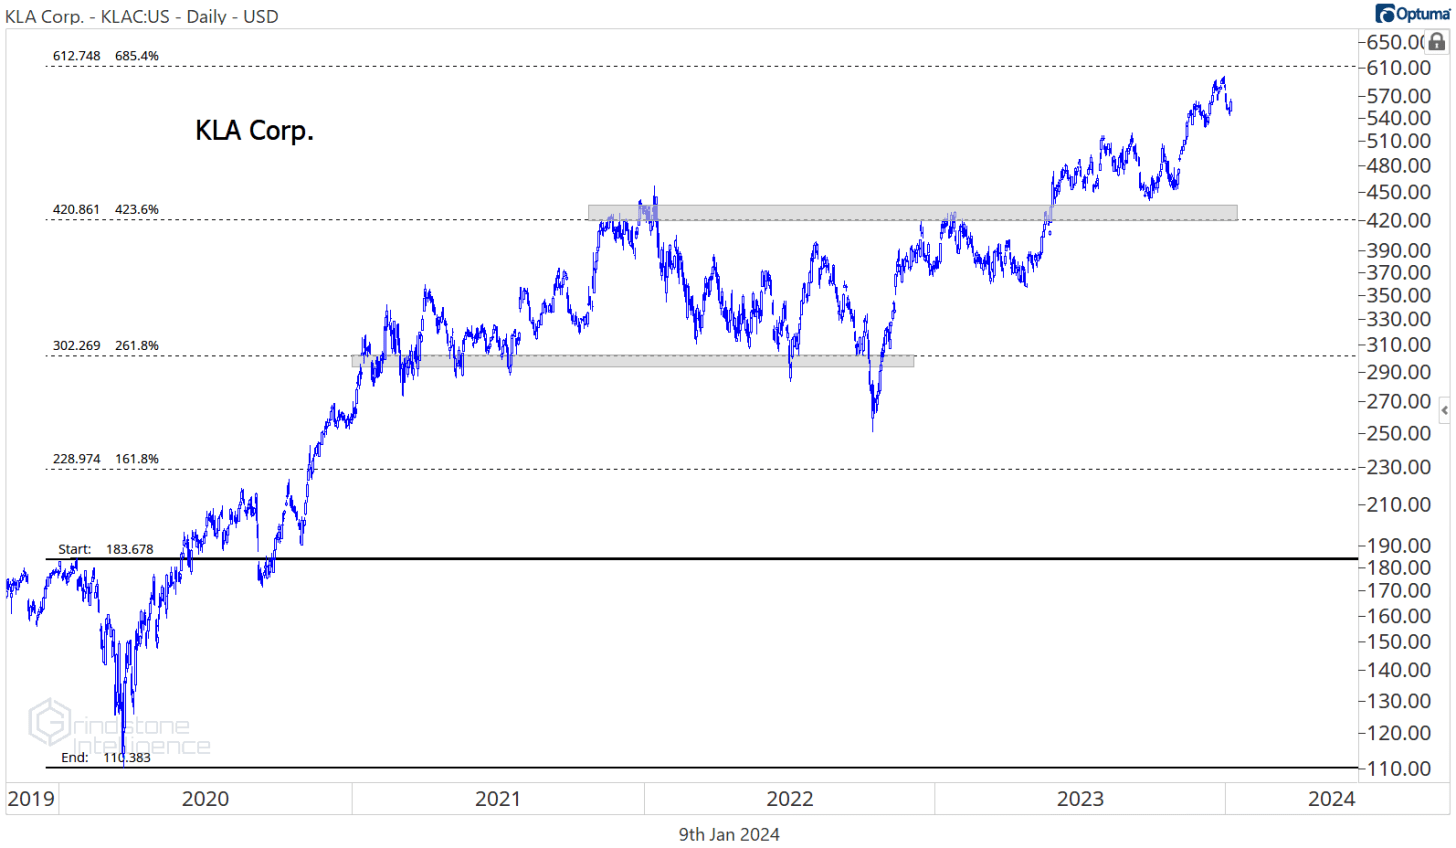
KLA Corp stalled out just shy of our $610 target.
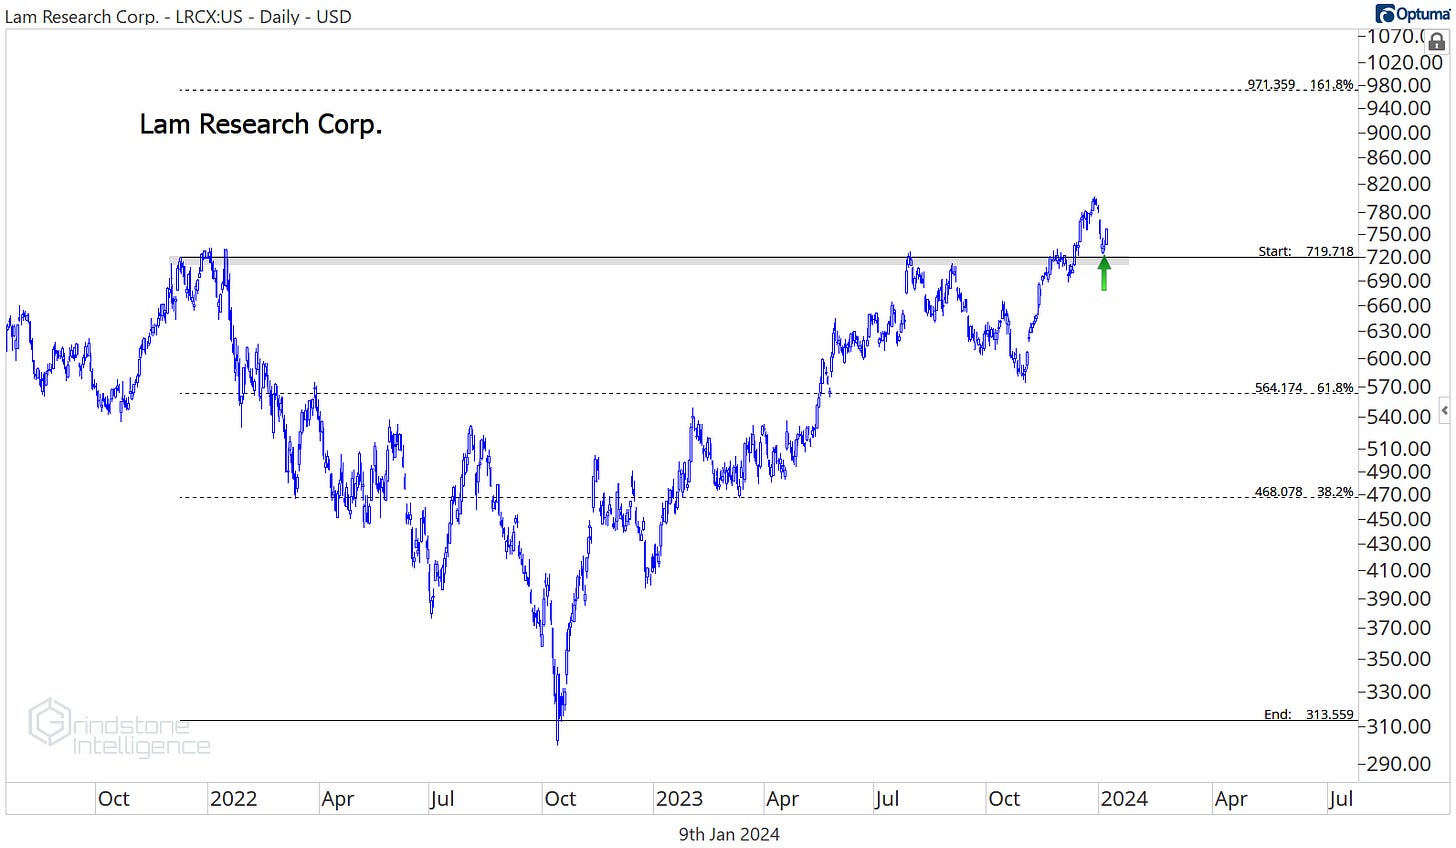
KLAC may still have room to run, but this definitely isn’t the place to be initiating new positions. Instead, we like the setup in peer Lam Research. LRCX just broke out of a 2 year base and then successfully backtested the breakout level last week. We like the risk/reward setup for this one above $720 with a target of $970.
That’s all for today. Until next time.


