

It's Beginning to Look a Lot Like 1998 - 12/21/2023
The median stock lagged the index in 2023

What a difference a year makes.
At the end of 2022, we applauded the great year that stock pickers had. Sure, the major indexes suffered through the most extended bear market we’d seen in more than a decade. But beneath the surface, things weren’t as bad as the looked. More individual stocks outperformed the index than in any year since 2009.
If you picked a handful of random stocks each year on January 1st, weighted them equally in a portfolio, and then remained invested in those stocks until the end of the year, you’d find yourself underperforming index returns in most years. It’s one of the worst-kept secrets in investing: a small group of stocks have generated most of the returns for US investors over the last century. That’s part of what’s made index investing so popular. Buying all the stocks ensures you’ll own the few on the fat tail of the distribution curve, and history has shown those great returns are enough to offset the detriment of also owning the laggards.
2022 was the exception to the rule. 59% of S&P 500 stocks did better than the benchmark, meaning stock-pickers had a better-than-even shot at picking leaders. But in 2023, we’ve seen a reversion to the mean... and then some. Just 29% of stocks are outperforming this year, the worst mark since 1998.

And those stocks aren’t lagging by just a little. Don’t get me wrong, there’s nothing bearish about the median stock being up 8% for the year. But that 8% pales in comparison to the 24% year-to-date rally for the index. The 16-point disparity between the index and median stock return is unmatched over the last 2 decades, with only the 22% differences in 1998 and 1999 being worse.

Yet there’s one stark difference between now and the late ‘90s. The dotcom era was marked by huge winners. Just adding “.com” to the end of a company’s name could generate massive gains in the market. At the same time, dozens of stocks were falling out of favor. Check out the fat tails of the distribution curve in 1998 and 1999, then compare them to this year. In 2023, a lot more stocks are falling near the middle of the curve. The fat tails aren’t so fat.
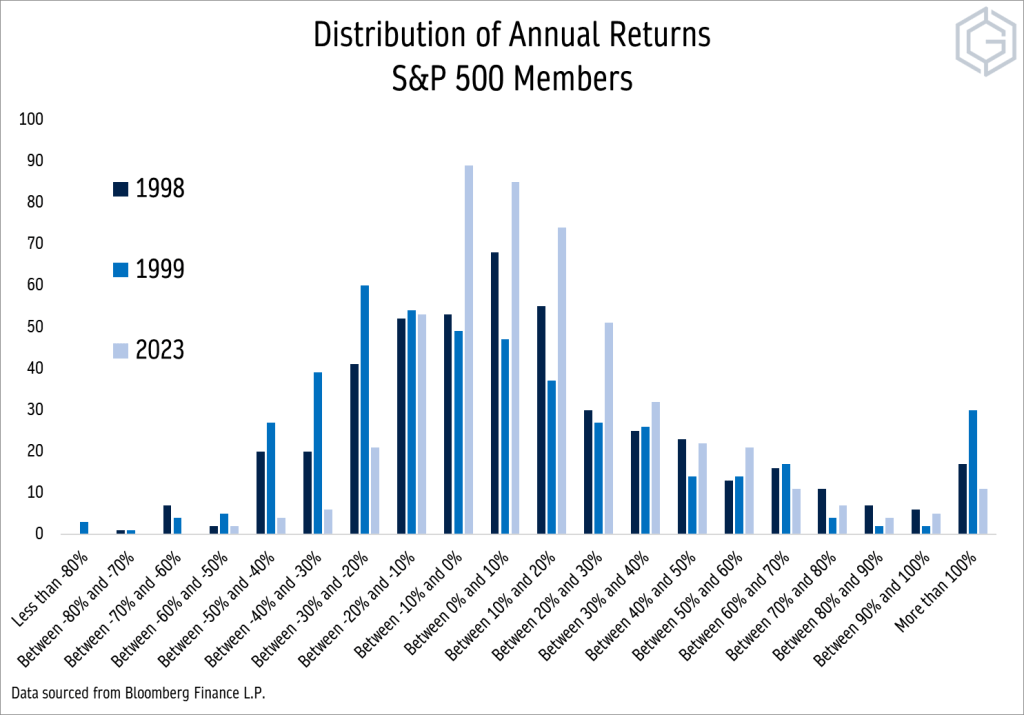
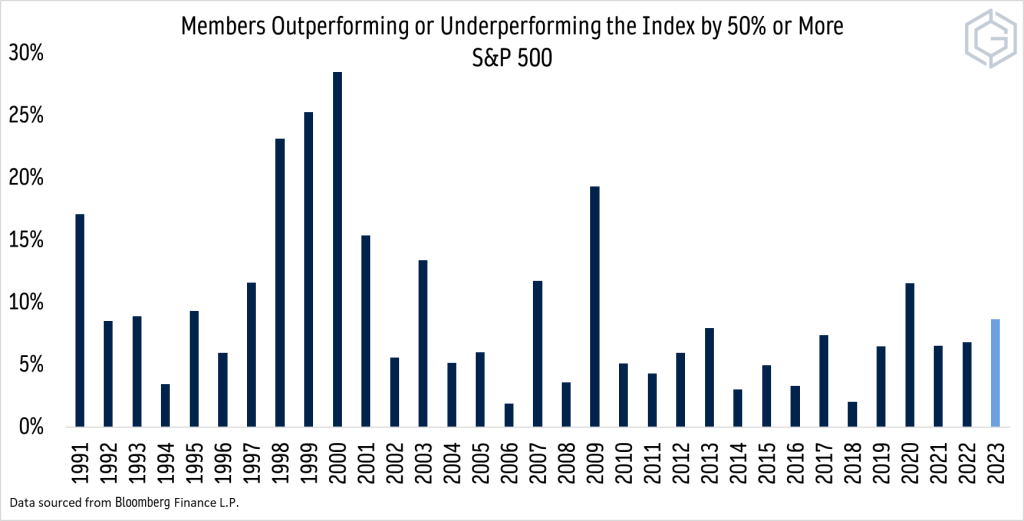
Here’s another way to look at it. In 1998, 1999, and even in 2000, roughly a quarter of S&P 500 stocks had annual returns that were either 50% above or 50% below the benchmark return. In 2023, just 8.5% of stocks are, a number not much different than the last decade.
So what gives? How can the median stock be lagging by so much when in some ways, the last year hasn’t really been that unusual?
Blame the mega caps. Since the S&P 500 is a market cap weighted index, the largest companies have the biggest impact on index returns. And nearly all of the largest companies in the index are growth stocks in a year where growth has been heavily favored. Here’s one more look at this year’s performance distribution. More than 30% of the largest 50 S&P 500 stocks have gained at least 50% this year. Just 10% of the total S&P 500 have.
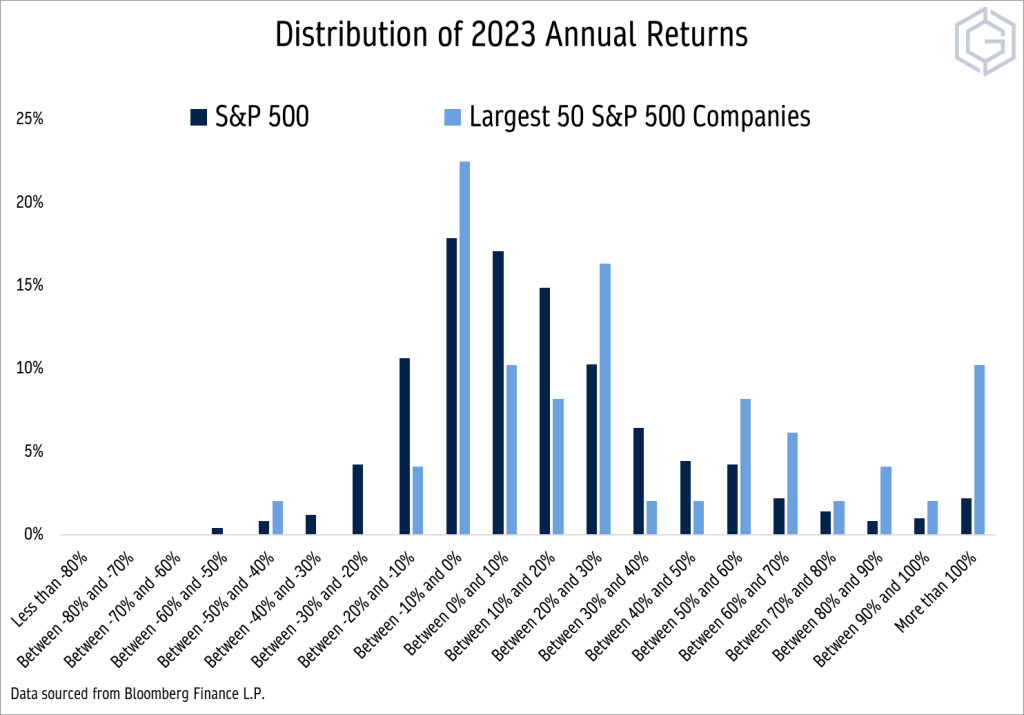
In short, it’s the biggest stocks that had the best year in 2023. That’s fantastic news for everyone invested in the index, but bad news for anyone trying to outperform the index.
Let’s all hope the rally continues in 2024.
Until next time.