Leaders and Losers: Industry Trends
We put a lot of emphasis on a top-down approach here at Grindstone. Yes, there’s tremendous value to be had in a bottom-up technical approach, too, which is why we sift through thousands of charts of individual stocks each month. When we’re just checking the charts of individual stocks, though, we can miss out on big themes in the market – especially if we aren’t in tune with the fundamental factors that drive each of those individual stocks.
Zooming out helps.
If you’re a regular reader of our work, you’ve probably noticed that our equity research process centers around the 11 GICS sectors. When we take groups of similar companies together, we can better identify the types of companies that are working best, and that can help us identify the most sustainable trends. And once we’re in the right zip-code, then we can spend our time deciding which companies within that zip-code we want to own.
Periodically, we go a step deeper than those sector-level trends and take a look at the “Industry” level of the GICS classification system. We’re looking at which groups have performed the best over the last few weeks and months, which ones are showing bullish momentum characteristics, and which ones are setting higher highs. Here’s the rundown:
The first thing we’ll point out is that near-term trends have softened materially. Just one-third of the industries we’re looking at have risen over the past 4 weeks, with the median one being 1% lower. Six weeks ago, the median industry had risen more than 3% over the prior month, and 80% of them were in the green.
Fortunately, we’ve yet to see much damage to the longer-term structure of this bull market. About 80% of these industries have set a new 3-month high more recently than a new 3-month low, and roughly the same number are in an overbought momentum cycle (have gotten overbought more recently than they’ve gotten oversold).
That doesn’t mean things can’t get worse. We’re still keeping a close eye on the risks we laid out in our most recent outlook, namely from rising interest rates and a strengthening US Dollar.
30-year yields have surpassed 4.5%
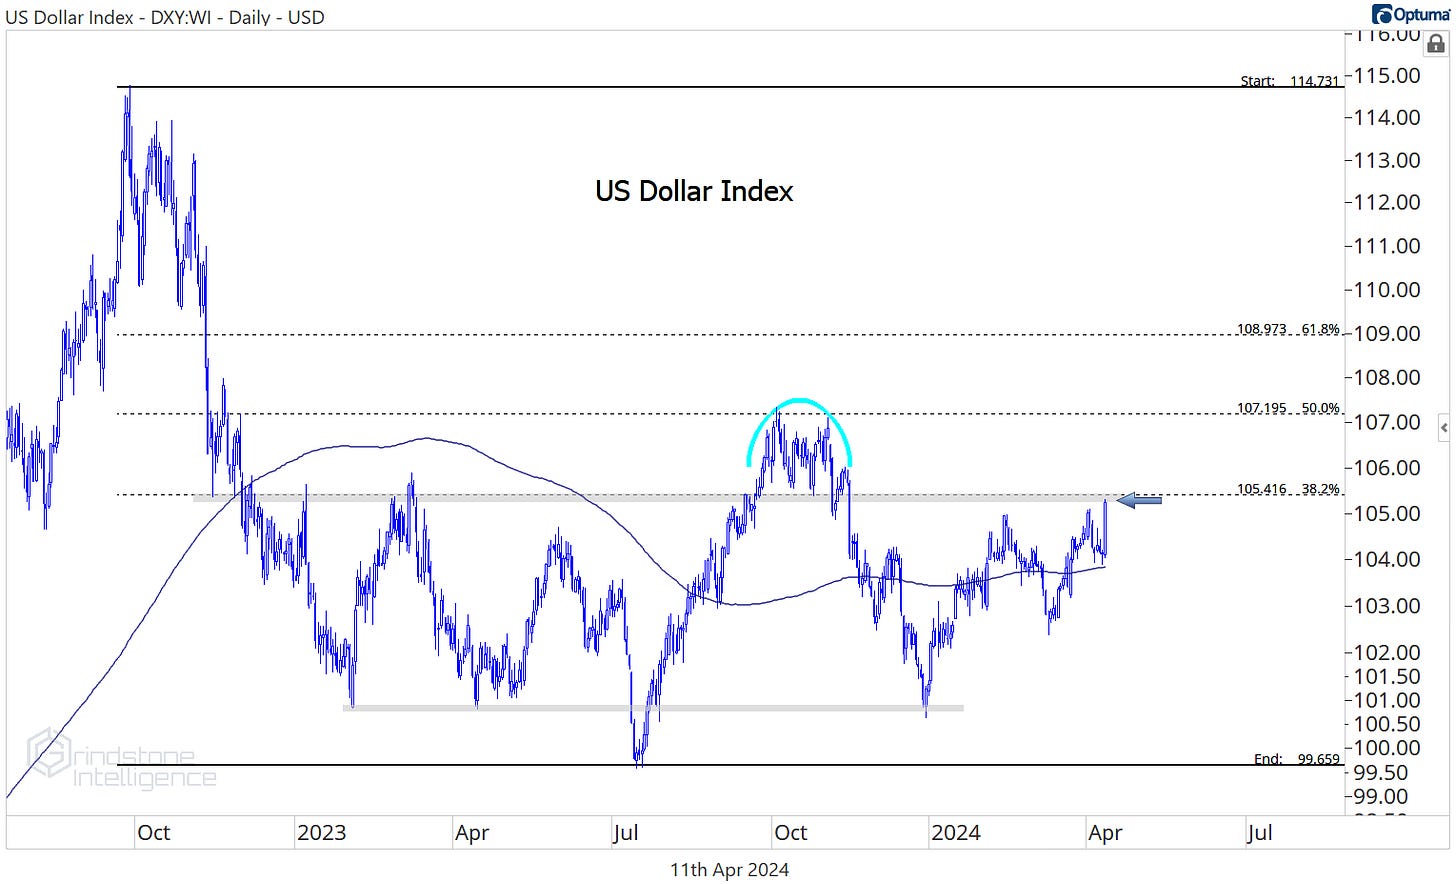
And the Dollar is right at our key level.
We set these levels for a reason. It’s not because we have special predictive powers of what will happen in the future if a level breaks. It’s because we don’t have any idea what the future holds. We set these levels in advance so that we’ll know exactly when our thesis about the trend is no longer intact. If we don’t hold our dumb human brains accountable, inherent behavioral flaws can cause us to abandon correct theses too early or hold onto incorrect ones too long.
If the Dollar Index confirms the breakout we already got in interest rates, we have to listen to what the market is telling us and start approaching this market with a more cautious perspective.
That may happen later today, but it hasn’t yet. Until it does, we’ll continue looking for stocks to buy.
The Metals & Mining industry was the best performing industry over the last month, rising 12.7%. Earlier this year, the group was resolving lower relative to the rest of the market following a multi-year head and shoulders top. From failed moves come fast moves in the opposite direction, and now we’re seeing new 6 month relative highs.
This long-term setup in Freeport-McMoRan has a great look to it now that FCX is above the 2023 highs. We like it above $45, which is the 261.8% retracement from the 2018-2020 decline, with a target up at the next retracement level of $70.
The Oil, Gas, & Consumable Fuels industry has the exact same relative signature as the Metals & Mining space: a failed head and shoulders top.
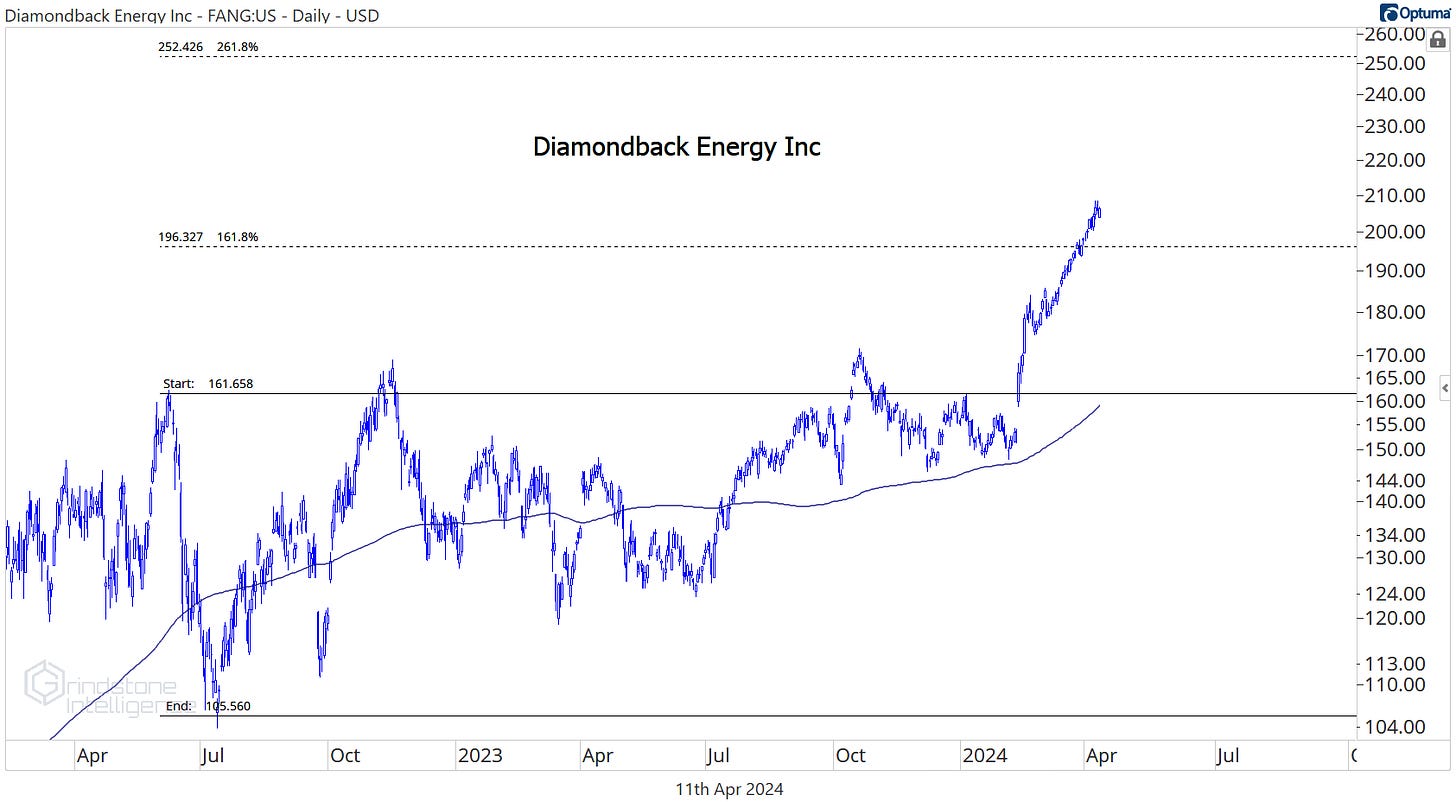
Diamondback Energy has been a leader, and we think it will continue to be so. We can buy pullbacks towards $200 with a target of $250.
The Communication Services sector has been one of the best places to be since the bear market bottom, but all of that strength was just a reversal of the outsized weakness during 2022. The Interactive Media & Services industry - home to sector juggernauts Alphabet and Meta - just broke out to new all-time relative highs following a 9% gain over the last month.
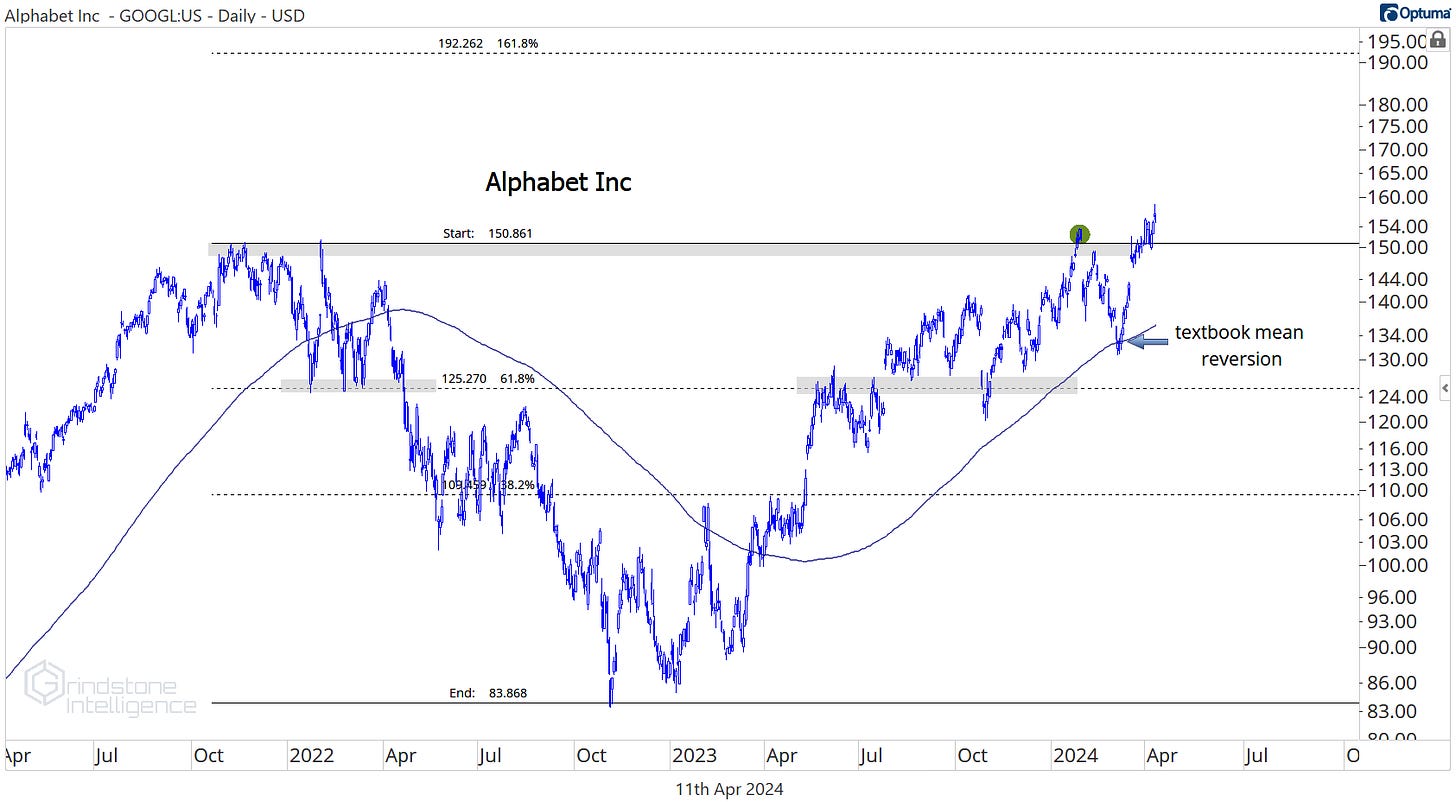
And Alphabet just surpassed resistance from its former highs. The last time we were here, a failed breakout resulted in a reversion back to the 200-day moving average, but not a full fledged trend reversal. This time around, we’re looking for that breakout to hold. We like GOOGL above $150 with a target of $190, which is the 161.8% retracement from the 2022 decline.
Sticking with market juggernauts, how about Broadline Retail - home to Amazon - breaking out of a 9 year relative base?
We still need to see AMZN break absolute resistance from its 2021 peak, but if it does, we like that we can manage risk at $190. Our target in that scenario is $250.
There was no big, bad bear market to reverse in the Construction & Engineering industry. This group has been steadily outperforming for several years.
The cup and handle continuation pattern we just broke out of should set the stage for further relative gains.
Quanta Services is the lone constituent of the group. Our target is $300, but we only want to continue holding it if PWR is above $245.
That’s all for today. Until next time.


