(Premium) Industrials Sector Deep Dive – October
We said it was make-or-break time for the Industrials. Well, they broke.
This massive failed breakout will most likely take some time to repair. Until then, we expect both the sector and the overall market to be choppy and rangebound.
All year we’ve applauded the relative strength within the Industrials. Even though the market cap weighted sector has underperformed in 2023, the equally weighted sector has not.
That’s a continuation of a trend that began in April 2022, when the EW Industrials bottomed relative to the EW S&P 500. We like looking at the equally weighted indexes (in addition to the market cap weighted ones, not necessarily in favor of) because they give us a better feel for how the average stock is doing. With our top down approach, this helps us identify trends and outperforming areas that might otherwise be masked by the dominance of mega caps.
Here’s what we mean: check out the weekly Relative Rotation Graph of the cap weighted Industrials compared to the cap weighted S&P 500. We see a sector that led last year, but then fell all the way to the ‘Weakening’ quadrant and appears headed there again.
Now contrast the equally weighted version of the same chart: Industrials have never even approached the left-hand side of the scale.
Unfortunately, Industrials bulls have to weather one more month of seasonal headwinds. Historically, October is among the worst months for Industrials vs. the benchmark. On the bright side, November, December, and February are the three best months, and they’re just around the corner.
Digging Deeper
Wondering how the Industrials can show so much relative strength on an equally weighted basis, but so much weakness on the surface? So were we. The culprit is Aerospace and Defense, which accounts for almost 20% of the sector and is down 14% for the year.
The industry’s struggles began around year-end, when prices found resistance at a pretty familiar level.
Leaders
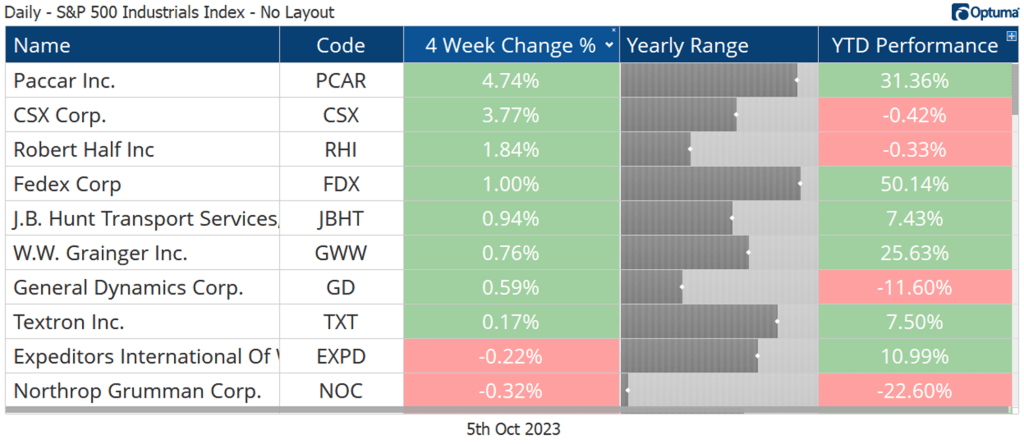
Paccar is the best performing stock over the last month, bringing its year-to-date gain to more than 30%. Near-term, the stock is stuck below resistance at $91. That’s the 261.8% retracement from the 2020 decline. If it can absorb that overhead supply, we’ll set our sights on the next Fib level, which is all the way up at $127.
The lack of absolute progress since Paccar’s summer peak masks the stock’s underlying strength. The rest of the sector just put in a failed breakout, remember? On a relative basis, PCAR just broke out above the 2020 highs.
Losers
Losers tend to keep losing. You’ve got to zoom out quite a bit to find support for 3M, which dropped another 17% over the last 4 weeks. Even then, the support you find doesn’t hold. MMM is back below its 2007 highs.
Growth Outlook
Industrial sector earnings growth is near the top of the scorecard in 2023. Only the Consumer Discretionary and Communication Services sectors are expected to outpace Industrials’ 10% projected growth. That’s well in excess of the S&P 500’s estimated 2% EPS decline for the calendar year.
Growth over the next two years is equally impressive, led by an estimated gain of 13% in 2024, followed by another 9% in 2025. Both would be above the long-term S&P 500 earnings growth rate of about 7%.
Other Noteworthy Charts
When so much strength is hidden below the surface, it would be a disservice not to share some of the other great charts we stumbled across this week. We present the following without additional comment.
AMETEK
Copart
Cintas
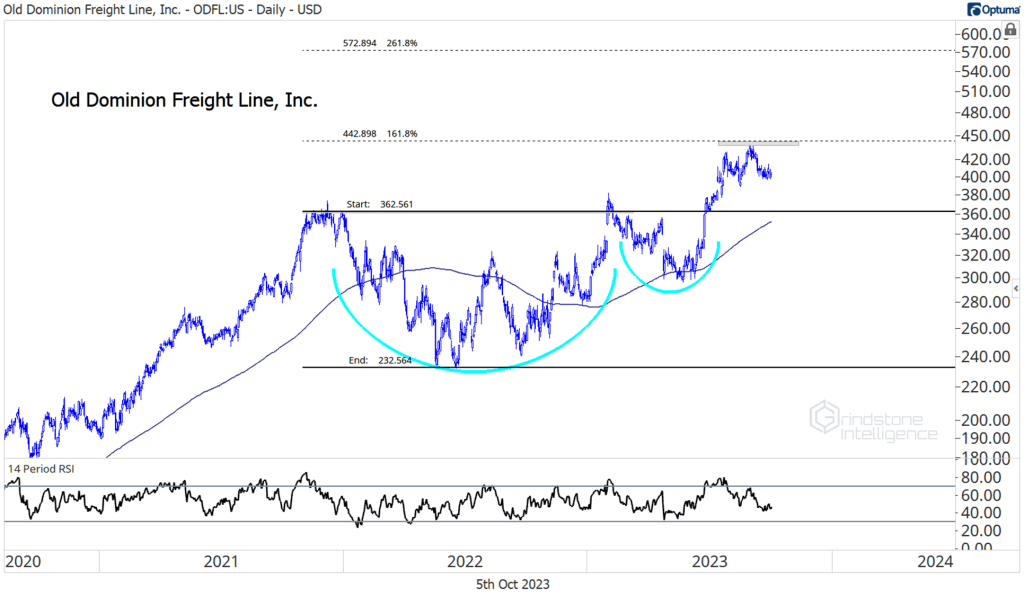
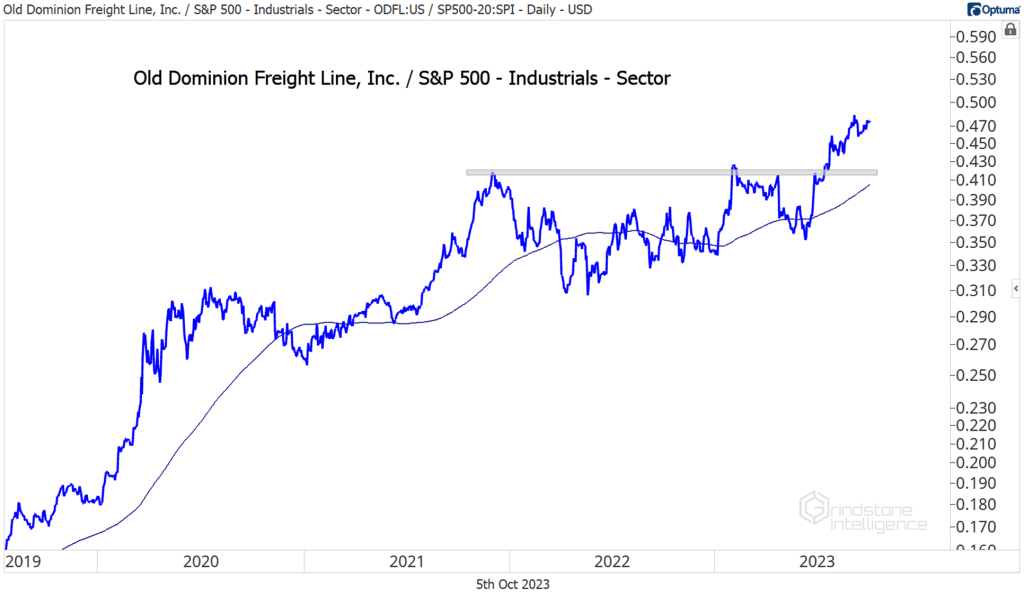
Old Dominion
Grainger
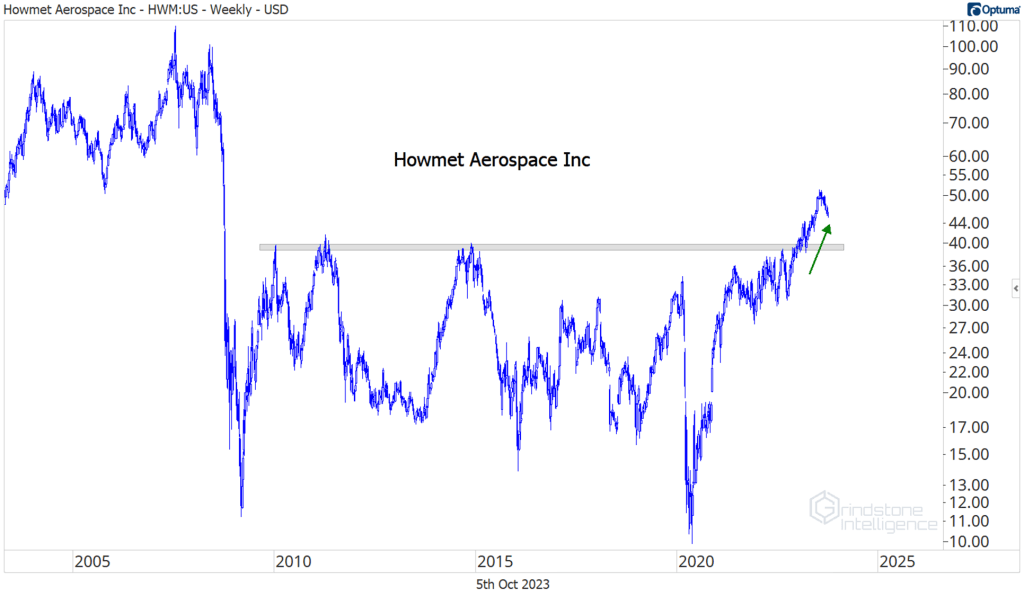
Howmet Aerospace
The post (Premium) Industrials Sector Deep Dive – October first appeared on Grindstone Intelligence.


