

Sector Ratings and Model Portfolio Update

We’re living in a different world than we were a year ago.
In 2023, it was mega cap growth stocks or nothing. Yes, more than just growth areas of the market were participating in the bull market. But the only way to outperform was to invest in those growth areas.
Check out the performance of the S&P 500 last year when you break it down by sector. In green are growth-oriented sectors, blue are value-oriented, and red are the risk-off sectors. It’s pretty clear who the leaders were.
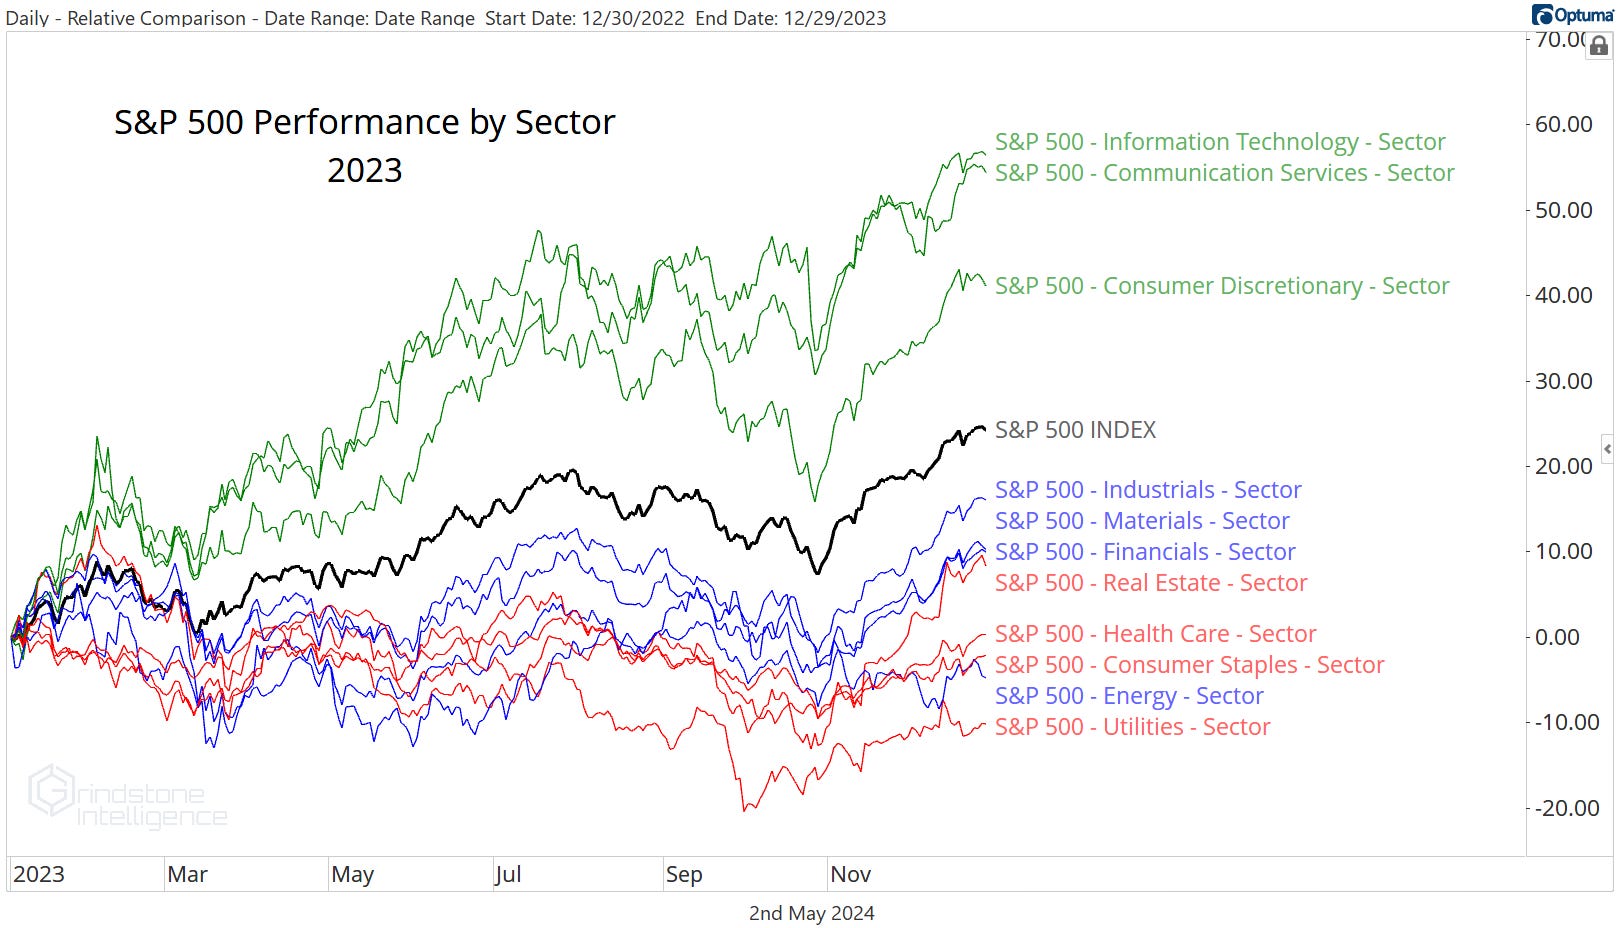
2024 is a different story altogether. Communication Services - a growth sector - is at the top of the leaderboard, and Real Estate is again a clear loser, but there’s no theme to be found for everything in between.

That’s a reflection of a market at a crossroads. Earlier this week, we weighed the evidence supporting a continuing bull market against that of an emerging bear. The bull is still intact for now, but bearish indicators are adding up.
There’s similar indecision within the market about which group is going to lead going forward.
Check out the ratio of the Russell 1000 Growth ETF (IWF) relative to Russell 1000 Value (IWD). This ratio was trending higher (growth > value) until September 2020, and then spent the next 3 years trying to surpass that former high. We finally got the breakout late last year, and we’ve spent most of 2024 consolidating above that key level of support. Consolidations like that usually resolve in the direction of the longer-term trend, which in this case is up. Growth should continue to be a leader. But last month that support level was broken.

From failed moves usually come mean reversions, and sometimes those mean reversions turn into outright trend reversals. Value sectors have a chance to take charge.
Here’s the Financials relative to the S&P 500 index. The ratio below is above its 200-day moving average and spent the first few months of the year consolidating above a key, one-year rotational level. Then it hit new 52-week highs in April.

The bank failures of a year ago are now firmly in the rearview mirror. This is an uptrend until proven otherwise.
The Industrials sector isn’t too far behind. It just hit new 8-month highs relative to the rest of the market.

And the Energy sector, which looked dead when it was breaking through a key area of relative support to start the year, is now back above the 1999-2000 lows.

So clearly value is the place to be, right?
Not so fast.
The Communication Services sector is still very clearly a leader. When compared to the S&P 500, it just broke out to multi-year relative highs after a 6-month cup and handle consolidation pattern (which itself followed a big inverse head and shoulders reversal pattern).

And don’t let Tech’s weakness over the last few months distract you from the fact that it just broke out of a 20-plus year relative base. That’s not bearish action.

Maybe - just maybe - it doesn’t have to be growth or value leading the way. Maybe it’s growth and value leading.
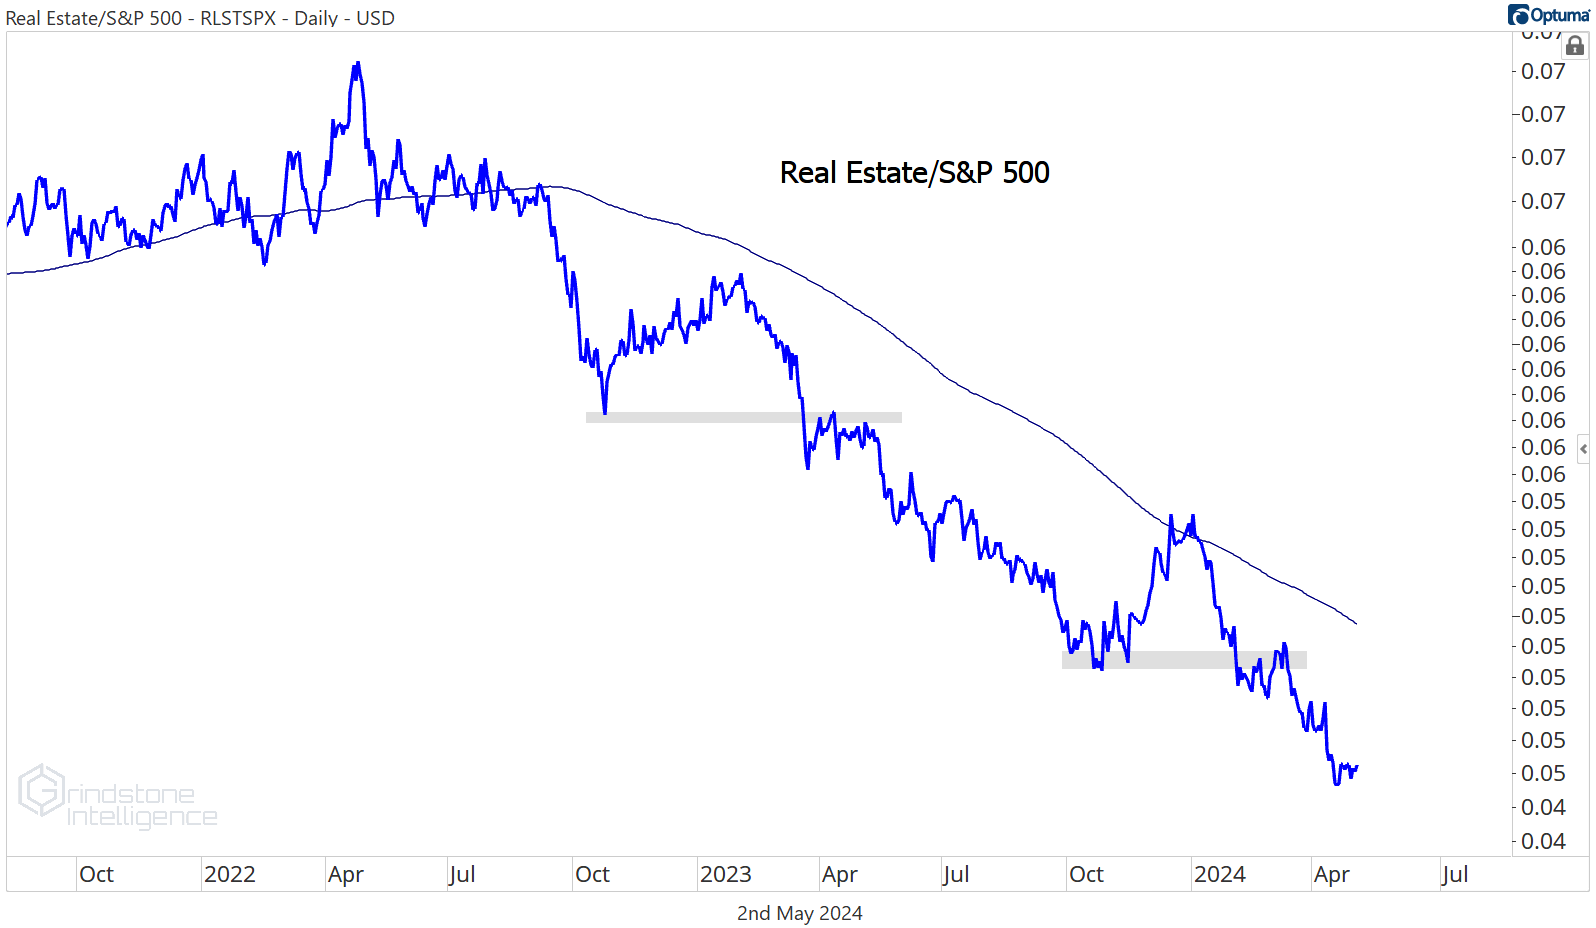
That would be healthy, and it can happen as long as the risk-off areas of the market continue to lag. Real Estate is at all-time relative lows.
Health Care broke to its lowest level against the S&P 500 in more than a decade earlier this year, and it’s still below those prior cycle lows.

And even though the Consumer Staples have outperformed over the past month, they’re still stuck below their own prior cycle lows.

April was a down month for stocks, but the weight of the evidence says we should continue to favor risk-on areas of the market.
Here’s an overview of how we’re looking at the sectors right now. Despite the selloff, we haven’t seen anything over the past month to warrant a shift in our ratings.

The Grindstone Intelligence Sector Ratings are based on our top-down technical approach. We assess the relative strength and trends within each sector and gauge risk appetite in the broader market to determine which sectors we think are best positioned to lead over the coming weeks and months.
In addition, here’s an update on the Model Portfolio - since our sector ratings were unchanged, there isn’t much reason to adjust the holdings. The US Equity Model Portfolio is a hypothetical allocation designed to align with our Sector Ratings. The positions are chosen with investment horizons ranging from one to several months. The Model chooses only funds that track sectors, industries, or categories of stocks - no individual stocks or cash positions are used.

That’s all for today. Until next time.