

Sector Ratings and Model Portfolio Update

It's still a risk-on environment, but leadership over the last month has shifted quite a bit. No longer is this a market where returns are dominated by a handful of mega cap growth names. The value-oriented areas of the market are helping to drive us higher, too.
Check out this year’s sector performance derby. The growth-oriented Communication Services and Information Technology sectors are sitting in the #1 and #3 spots, respectively after finishing at the top of the scorecard in 2023. But unlike 2023, Energy, Financials, and Industrials are all outperforming the benchmark index as well.

We’re living in a different world than we were a year ago, one where leadership and participation in the bull market is much broader. One thing hasn’t changed, though: risk-off sectors are still lagging. The Real Estate, Utilities, and Consumer Staples sectors are each trailing the overall S&P 500 by half in 2024, and despite being a leader through the first two months of the year, Health Care has slipped behind, too.
That’s a good thing for stock market bulls. Risk-off areas should lag in healthy bull markets. That’s evidence of risk-appetite among investors, and risk appetite is what drives bull markets higher.
If the Consumer Staples weren’t breaking below their 2021 lows relative to the S&P 500 and instead were outperforming, that would be evidence that something was amiss. But that’s not what we’re seeing. The Staples/SPX ratio just hit its lowest level in more than 20 years.

We don’t believe Health Care is always a risk-off sector (it outperformed during the early stages of the dotcom bubble and again out of the 2011 lows), but it’s certainly acting like one right now. We’d been eying that bullish momentum divergence forming at the 2021 lows and believed that was a perfect time for the bulls to step in on Health Care. But instead of working off that divergence with a rally higher, we worked it off through time. Now, the Health Care/SPX ratio is at decade-plus lows.

Communication Services is a mirror image. When compared to the S&P 500, it’s breaking out to multi-year relative highs after a 6-month cup and handle consolidation pattern.

And the Financials could be the next to see a bullish resolution. The ratio below is above its 200-day moving average and found support at a key, one-year rotational level earlier this year. A breakout would only serve to cement the the Financials as a leadership group going forward.

No sector has been more impressive over the last month than Energy, though. Two weeks ago, we posed the question: Is this finally the time for Energy stocks?
The answer is yes. Energy is checking all of the boxes we asked it to.
Crude oil is above our key level of $82.

Compared to the S&P 500, Energy is back above the turn-of-the-century lows, a level that sparked a major downside acceleration in early 2020 and then later acted as support in 2022 and 2023. With the outperformance over the last month, the late-2023 relative breakdown is starting to look like a big bear trap to us.
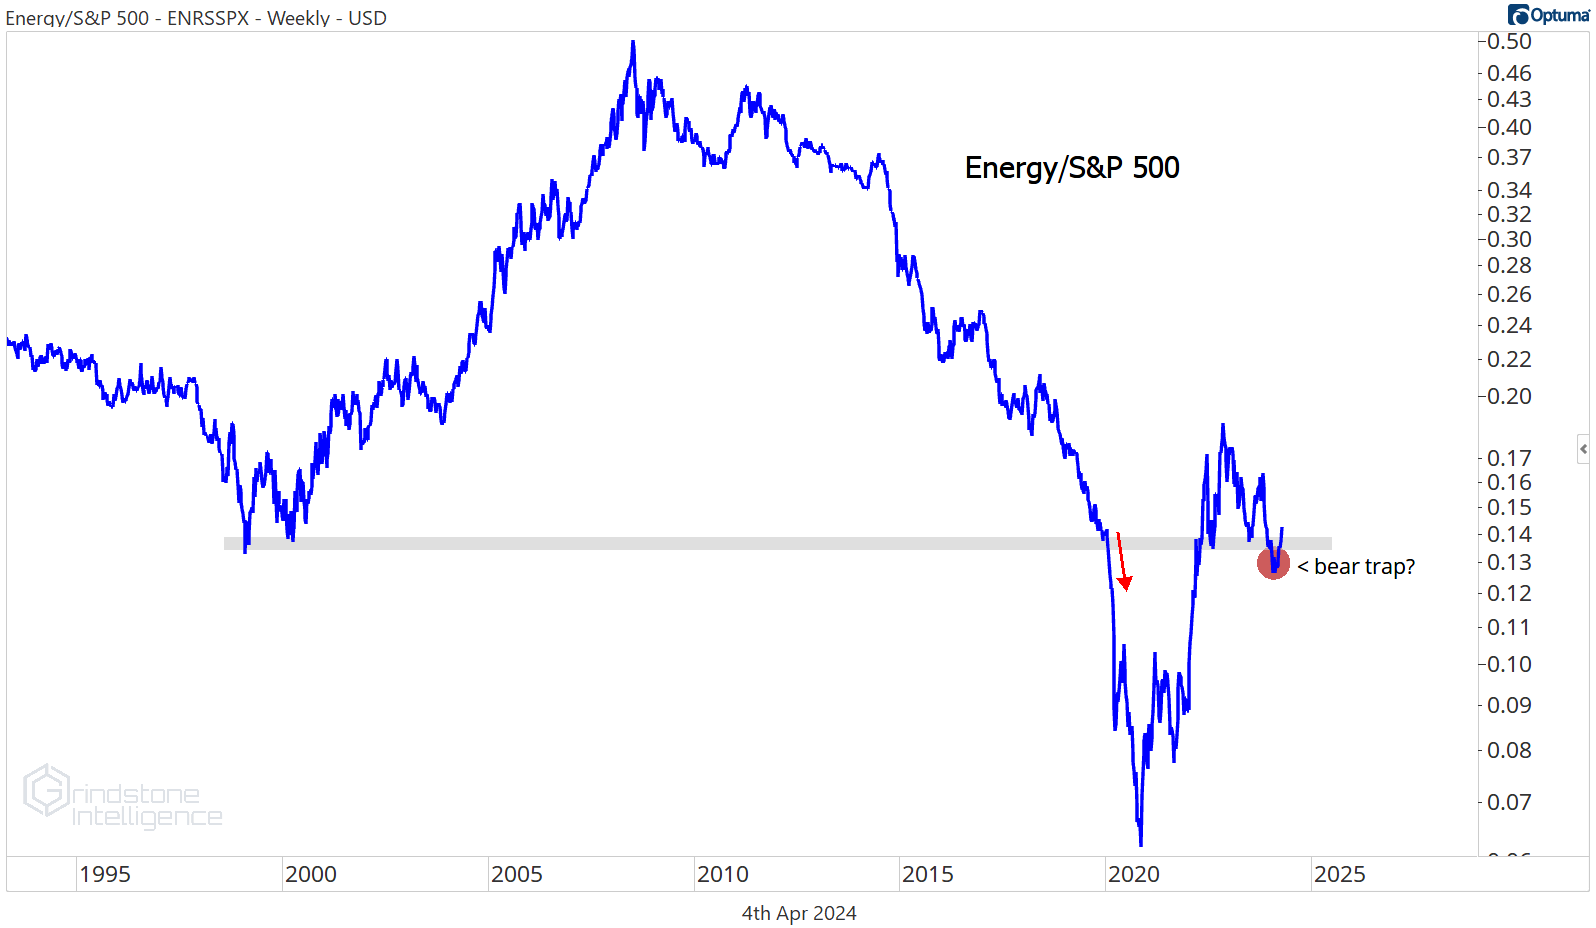
And most importantly, Energy just broke out of a 15 year base to set an all-time high. That’s simply not bearish.

Here’s an overview of how we’re looking at the markets right now.
The Grindstone Intelligence Sector Ratings are based on our top-down technical approach. We assess the relative strength and trends within each sector and gauge risk appetite in the broader market to determine which sectors we think are best positioned to lead over the coming weeks and months. Here’s an overview of how we’re looking at the markets right now.

In addition, we’re making the following changes to the Model Portfolio. The US Equity Model Portfolio is a hypothetical allocation designed to align with our Sector Ratings. The positions are chosen with investment horizons ranging from one to several months. The Model chooses only funds that track sectors, industries, or categories of stocks - no individual stocks or cash positions are used.

The biggest adjustment here is to the Energy sector. We didn’t like Energy as long as it was stuck below the 15 year resistance and the Energy/SPX ratio was below the 2022 trough. Neither of those things are still the case.
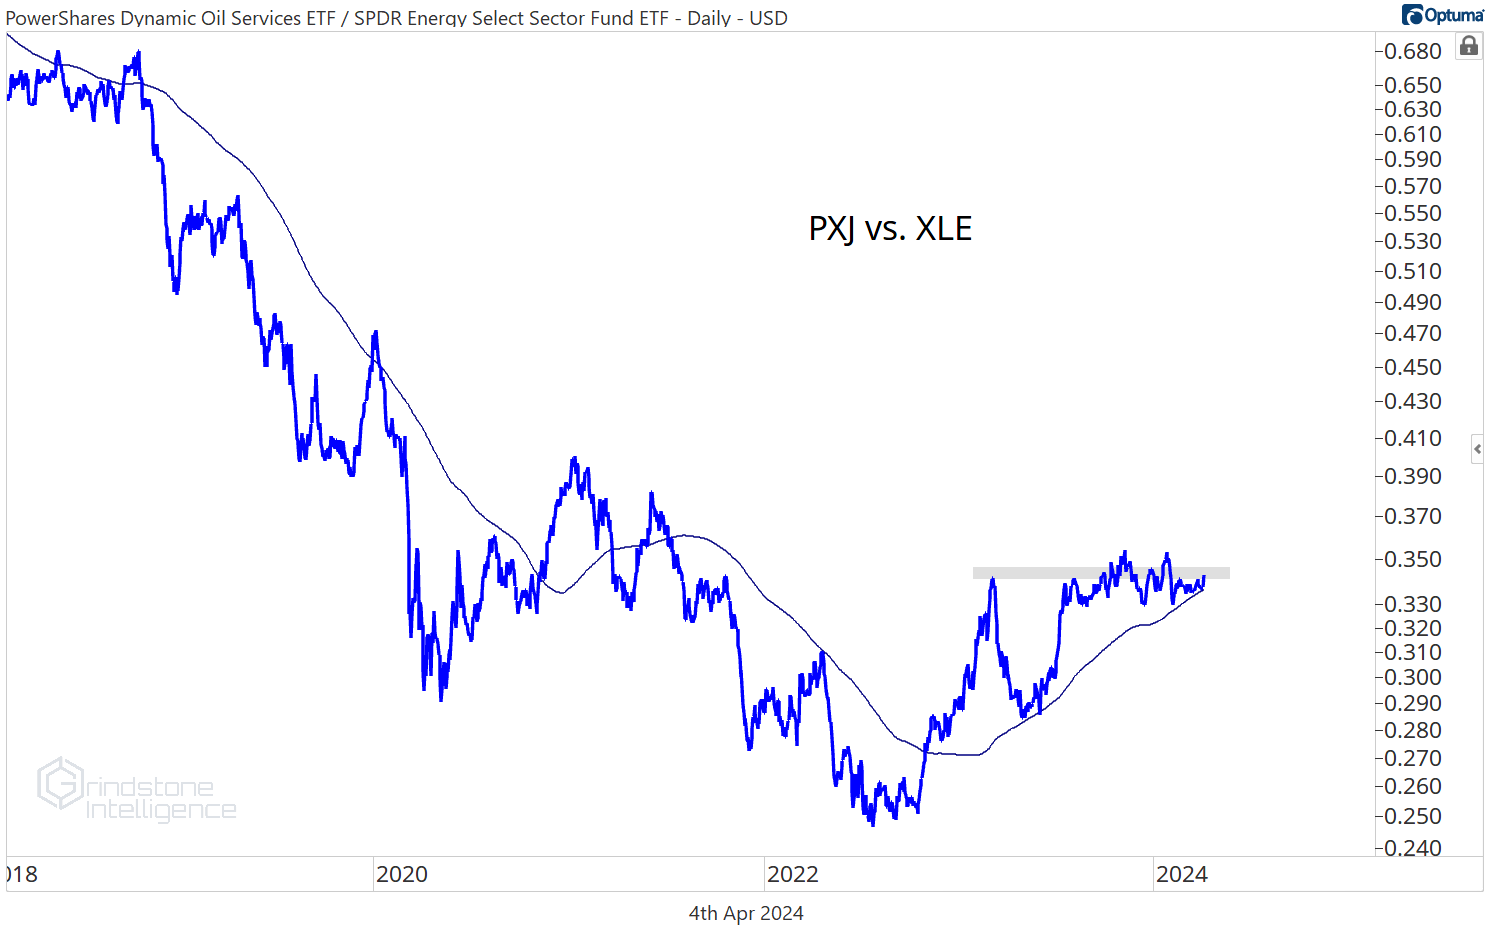
PXJ, the Powershares Oil Services, has been outperforming the rest of the sector for the past few years. The PXJ/XLE ratio has been above its 200-day moving average since October 2022, and it’s been consolidating within the uptrend for more than 12 months now. We think a relative breakout is imminent.
We feel similarly about this multi-year consolidation in RSPG relative to XLE. When Energy stocks rise, we tend to see the equally weighted sector do better than the market cap weighted one. And we do love that inverse head and shoulders continuation pattern.

Within Consumer Discretionary, we continue to be impressed with the relative strength of the homebuilders. Here they are setting multi-year highs relative to the rest of the sector.

And even though we downgraded the Health Care sector this month, we aren’t completely giving up on the biotech space. The risk/reward here in XBI is very clean after it broke out above the 2015 highs. If it’s falling below $90, we have to pull the plug. But that support level is intact for now, and we think it can go to $120.

That’s all for today. Until next time.