Struggling Small Caps
Lag on the way up, lag on the way down. That’s the story of the small caps.
During the bear market of 2022, the small caps were the first to stop going down, and for a moment, it looked as though they might be poised to lead on the way back up. Instead, the small caps were entirely absent from the rally for most of 2023, even managing to set new lows last October.
The lead-in to 2024 was a different story, though, as the small caps were the best place to be in November and December. We even got the long awaited breakout to new 52-week highs.
Unfortunately, the strength stopped there. Yesterday, the S&P 600 capped off the reversal by hitting a new 4-month low.
On a relative basis, things are even worse. IJR, the S&P 600 ETF, is on pace for its lowest weekly close versus SPY, the S&P 500 ETF, since 2009. To put it mildly, new lows are not something you see in uptrends.
Part of the reason small caps have been so weak relative to the large caps is because of sector exposure. For the last 18 months or so, growth stocks have handily outperformed value-oriented ones. And if you look at the types of stocks in the large cap and small cap indexes, you’ll find a sharp disparity: the S&P 500 is dominated by growth-oriented sectors (like Information Technology, Communication Services, and Consumer Discretionary), while the S&P 600 has a distinct tilt towards value (like the Industrials, Financials, Materials, and Energy sectors). So it makes sense that the small cap index would be lagging, because it’s held a bunch of the bad sectors and hasn’t held enough of the good ones.
Lately, though, the weakness within small caps has become more apparent even on an intra-sector basis. There are 10 small cap sector ETFs out there, and 6 of them are setting new 3-month lows compared to their large cap counterparts.
The relative weakness in small cap Tech isn’t too surprising - almost everything has lagged the large cap Tech sector:
But how about the small cap Industrials, which had been outperforming the large cap sector for more 2 years, and were just a few months removed from breaking out of a big base? This week’s breakdown is a bad look.
The same goes for the small cap Consumer Staples sector. The small caps were just coming out of a 5 year base relative to the S&P 500 Staples. Now, this ratio is down below a falling 200-day moving average. We’re no longer looking at an uptrend.
Even more concerning than the relative underperformance is the outright weakness in breadth that’s showing up. Remember, short-term trends have weakened in the S&P 500, but two-thirds of stocks in the index are still above their 200-day moving average, and half of them are above their 100-day.
The small caps are significantly worse than that:
The nail in the coffin would be an expansion in the number of stocks setting new lows. We judge whether each stock is in a cycle of setting new highs or new lows based on whether a new high or new lows has occurred more recently. In the S&P 600, the number of new 3-month lows already outweighs the number of new 3-month highs, and we’re watching to see whether that short-term weakness bleeds into the long-term picture.
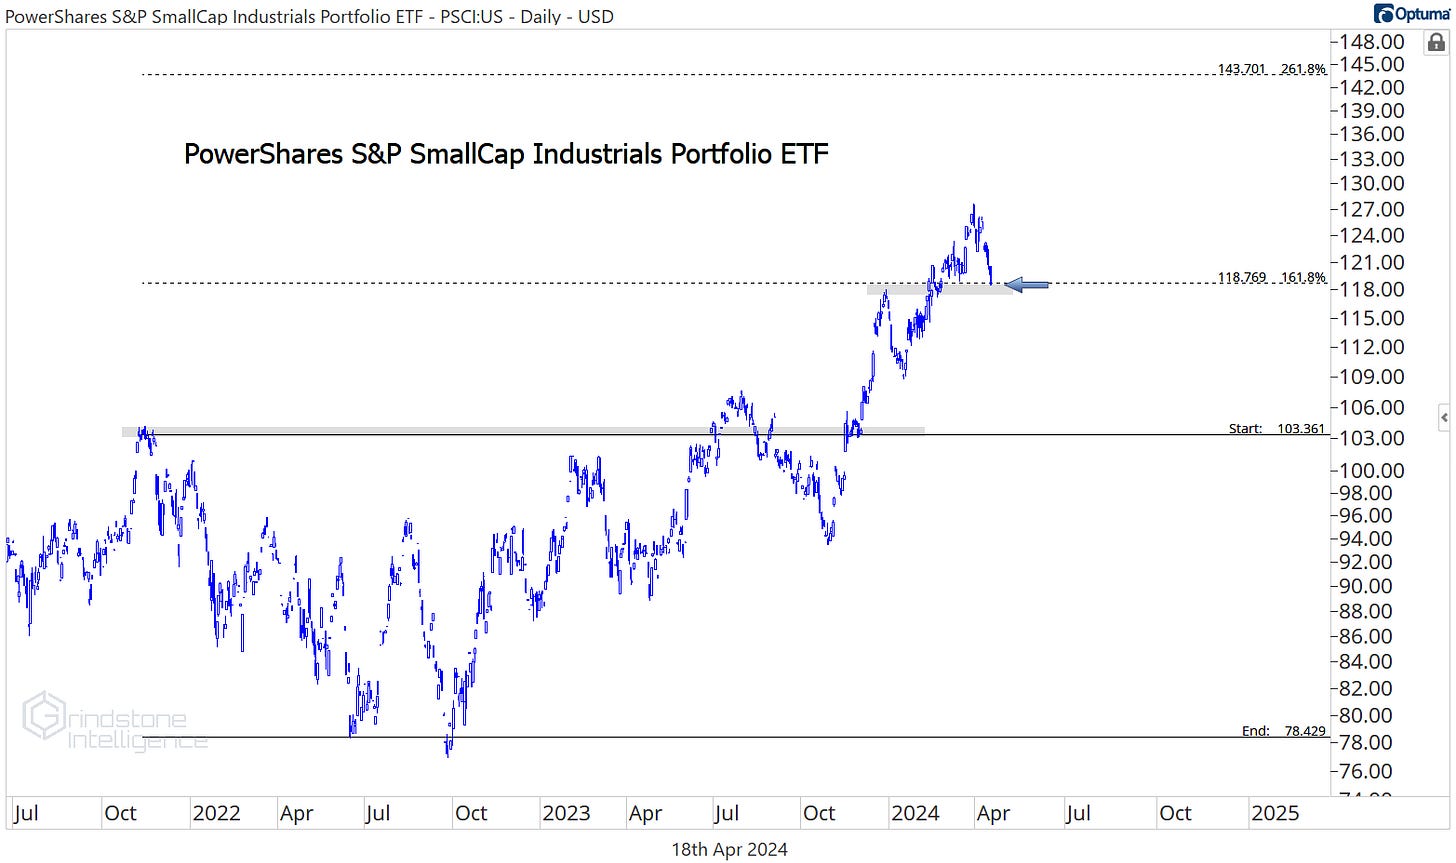
Are the small caps going to stabilize? We think it’ll be the Industrials that tell us. The small cap Industrials are backtesting the 161.8% retracement from the 2022 decline, a level that also marked a short-term peak in December. This is a place where the buyers should be stepping in to defend - doing so keeps this uptrend very much intact. If they don’t, that’s a problem.
We can’t overstate how important the small cap Industrials have been. Not only are they the largest sector in the S&P 600, they’ve also been far and away the best performing one. Here they are compared to the benchmark:
Your eyes aren’t playing tricks. Yes, that’s a weekly chart, and yes, it’s log scale. So if not even the Industrials can find support, how can we expect small caps as a whole to be rallying back?
That’s all for today. Until next time.


