Tech Sector Outlook
Top charts and trade ideas from the Information Technology sector
Yesterday, we detailed the mounting risks to the bull market. The bearish evidence is starting to pile up.
The trouble really began in early March, when the biggest and most important sector in the index ran into the 161.8% retracement from the 2022 decline. Momentum was putting in a bearish divergence at the same time, and now Information Technology has gone nowhere for the last 6 weeks as it digests the big gains from the prior 6 months.
Failing to surpass a logical area of overhead supply wasn’t necessarily going to be a problem for this bull market - it wouldn’t have been a problem at all if other areas of the market had stepped in to lead. After all, rotation is the lifeblood of bull markets.
But leadership from the Financials and Health Care sectors (the next two largest sectors in the S&P 500 after Tech) proved to be short-lived. Both are now back below their 2022 highs, so instead of seeing a major reversal in the Russell 1000 Growth vs. Value ratio, we’ve instead seen continued consolidation above the 2020-2021 highs.
In other words, growth stocks are still very much in the driver’s seat. That’s a problem since growth stocks are falling.
Perhaps we shouldn’t be surprised at Tech’s continued leadership - Tech has been a leader for a long time. Just check out the performance of the S&P 500 and each of its 11 sectors over the past 5 years. Information Technology has been so dominant that every other sector has underperformed. Not just underperformed Tech, mind you. They’ve all underperformed the S&P 500. Ten of the 11 sectors have been worse than ‘average.’
For now, long-term trends in the market remain intact. Though 71% of S&P 500 constituents are below their 50-day moving average - the worst mark since last November - about two-thirds are still above their 200-day moving average. Yes, that’s the worst long-term moving average breadth reading of the year, but it’s not yet at levels consistent with a full-fledged trend reversal. And it’s encouraging to see that risk-on sectors continue to exhibit the most strength. The two weakest sectors are Real Estate and Utilities, the two sectors most negatively impacted by elevated interest rates thanks to their heavy debt loads.
So long as the long-term uptrend remains intact, we’ll continue to look for stocks to buy. Though with risks more elevated now than they’ve been since last fall, we’ll need to be selective.
Digging Deeper
There are 11 sub-industries in the Information Technology sector, and it’s pretty clear who the leader has been: the Nvidia-led semiconductors are up 104% over the past year. But don’t be fooled into thinking that it’s only the semiconductors that have done well. Seven of the 11 are up at least 20% over that period, despite the recent pullbacks, and only one sub-industry is in negative territory.
This action in the Systems Software space is almost identical to that of the overall sector. Check out the bearish momentum divergence right as prices ran into the 161.8% retracement from the 2022 decline:
Microsoft’s size dwarfs the impact of the sub-industry’s other constituents, so MSFT has the same structure. The risk/reward in this one isn’t in our favor so long as it remains stuck below $430.
Leaders
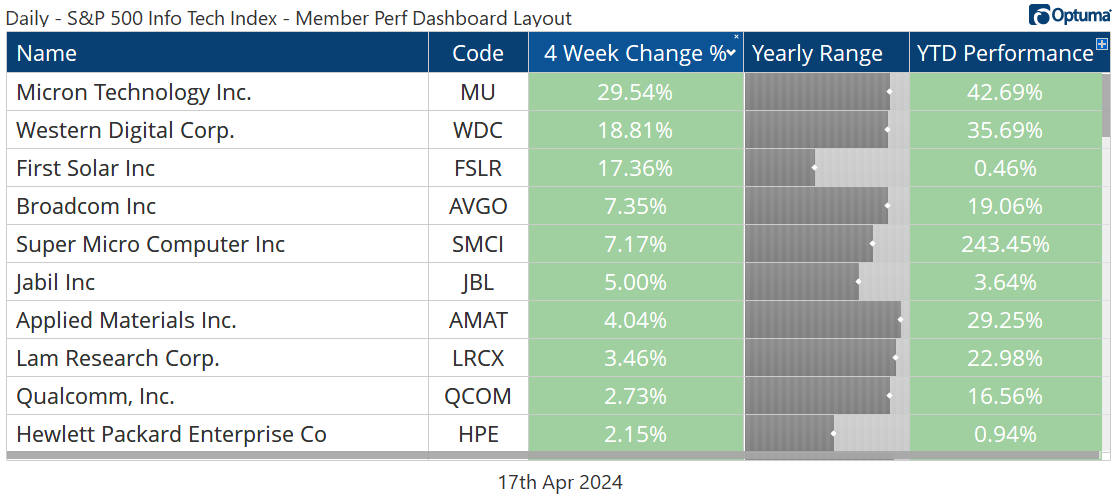
Microsoft isn’t the only stock that’s running into a logical area of resistance. In fact, that’s a pretty consistent theme in the market these days. Micron was the best performing stock in the sector over the past month, and it’s up more than 40% year-to-date. But so far it’s been unable to get past the 161.8% retracement from the 2021-2022 decline.
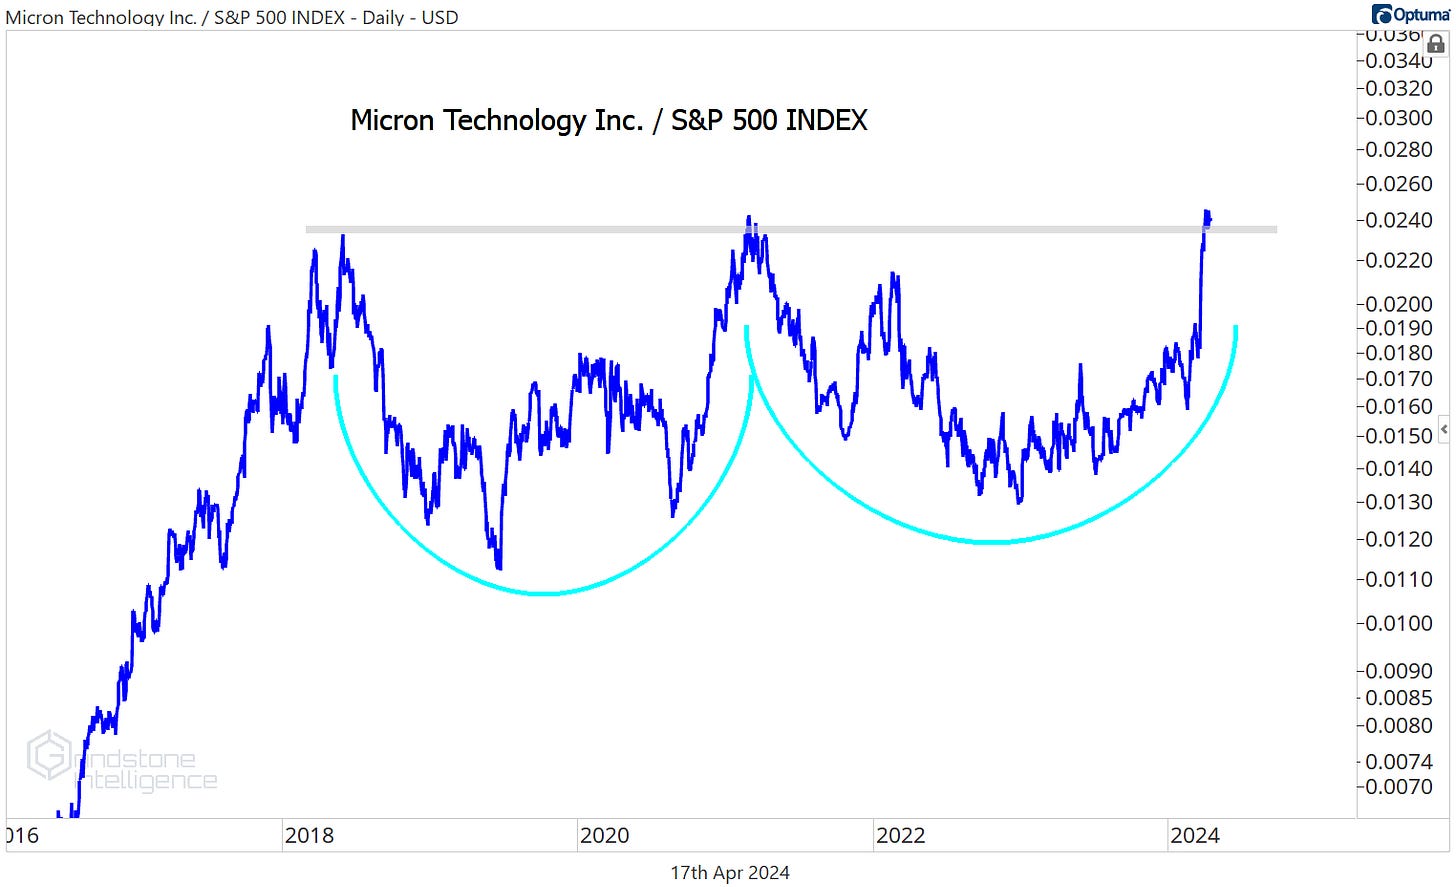
Longer-term, though, we love the relative strength in Micron. Check out this multi-year breakout that’s shaping up in MU vs. the S&P 500:
As long as that relative strength holds, we can be buying MU above $130 with a target of $175.
Broadcom has been one of our favorites for awhile, and it continues to trend steadily higher relative to the rest of the market. Whether the S&P 500 is rising or falling, AVGO has tended to do better.
The stock hit our former target of $1360, which is the 685.4% retracement from the 2020 decline, a little more than a month ago, and it’s been best to be on the sidelines since then. On a breakout above $1400, though, we’ll have a great opportunity for a new trade with a target up above $2100.
From big bases come big resolutions, and I can’t think of too many bases bigger than this one. It took Applied Materials more than 20 years to surpass the relative highs it set during the dotcom bubble, but it finally did it this year.
Unfortunately, the risk/reward isn’t too favorable for the stock right now as it sits midway between two Fibonacci retracement levels from the 2020 decline. We’ll be keeping an eye on this one for a more attractive entry.
We prefer the setup in AMAT’s peer Lam Research, which is consolidating near the 161.8% retracement from its 2022 decline. With LRCX, we want to be buying a breakout above $1000 with a target of $1400 - but we only want to be long above that level. Otherwise, our bullish thesis on the semiconductor equipment space is at risk.
Losers
Here’s another stock that found resistance at a key Fibonacci retracement level. Arista Networks has dropped 8.4% over the last 4 weeks, but it’s still one of the YTD winners, up 11.5%.
And it’s still in a relative uptrend, too. Late last year, ANET broke out of a multi-year base versus the rest of the Tech sector:
Should this bull market continue, we can expect ANET to continue being a leader as well. In that scenario, we want to be buying it on a move above $300 with a target of $450.
It’s important to own the things that are outperforming the market if your goal is to outperform the market. Just as important - maybe even more important - is not owning the things that are underperforming. Cognizant Technology Solutions just broke to new lows vs. the rest of the market. There’s no reason to be involved.
The same goes for Accenture, which is in freefall when compared to the rest of Tech. Could we see a huge rebound here for ACN on an oversold bounce? Sure. But trying to catch falling knives during a bull market seems a poor use of resources.
The same goes for EPAM.
One More to Watch
All across the Tech sector and the market overall, we can find stocks running into resistance and consolidating below key levels. What’s less common is seeing a stock consolidate above a key level. That’s exactly what ServiceNow is doing. It’s spent all year hanging out above the 2021 highs.
That consolidation has it gearing up for another run at these highs relative to the rest of the market. Failed breakouts like the one in NOW/SPX earlier this year sometimes lead to trend reversals, but more often than not, they’re act like false starts. After the racers reset and get back to the starting line, we think the most likely outcome for this ratio is a resolution higher.
That means we can be buying ServiceNow above those 2021 highs of $700 with a target up near $1000.
That’s all for today. Until next time.


