Weighing Bearish Evidence in a Bull Market
Rally on hold until further notice
It pays to be an optimist.
Stock prices are volatile, everyone knows that. More often than not, though, investors have been rewarded for riding out the waves. Only about half of all trading days end up in the green, yet over the last 100 years or so, 73% of years have yielded positive returns. That’s equated to an average gain of about 10% per year.
So why do this? Why come in each day, work to identify trends and relative strength, and manage risk if the key to success lies in doing nothing at all?
It’s because we believe that managing risk is the best way to help us achieve those long-term positive outcomes. An average of 10% per year is quite different from getting 10% every year. In fact, even in US financial markets (where history isn’t disrupted by an equity market that goes to zero), investors have had to live through extended stretches of near-zero inflation-adjusted returns. We’re not talking about 2 or 3 years of disappointing price action. No, we mean 2 to 3 decades. Imagine going to bed at 45 years old knowing that you’re well on track to meet your financial goals and will get to spend your later years reaping the benefits from your prudent investment choices. Then you wake up at 65 and learn that your investments over the last 20 years have yielded NOTHING in terms of increased purchasing power. It’s happened more than once.
That’s not a prediction of what will happen. It’s a very low probability outcome. But it’s not a zero-probability outcome. Financial markets are capable of a lot more than most people think.
For us here at Grindstone, knowing that such a wide range of outcomes is possible is what makes us so focused on managing risk. Yes, it pays to be an optimist most of the time, and that’s the direction we generally need to err. But we aren’t too interested in experiencing the worst outcomes if they can be avoided, and for that, we’re willing to accept that we may not experience the best ones, either.
We started the year with a post titled The Bear Case for Stocks. It wasn’t that we were bearish right then - quite the opposite - but we’ve always found value in trying to find evidence that runs counter to our thesis. If we’re always looking for where we could be wrong, we’ll have a better chance of knowing when we are wrong. In January, we focused on the lack of new highs within the market, bearish momentum divergences in the Tech sector, and an S&P 500 index that was still stuck below the former highs.
“Most of this evidence,” we acknowledged, “points to a bull in need of a rest, rather than the start of a major decline. So what would it take for us to turn more bearish?
“How about the return of Dollar strength? All throughout 2022 and 2023, it seemed the US Dollar was driving the boat. Every time the Dollar rallied, stocks were under pressure. And when the Dollar relented, equities moved higher.
“As long as the US Dollar Index is stuck in this range between 100 and 105, we think this bull market in stocks can remain intact… But if the Dollar is above 105, the story changes. We’d have to start taking the bearish evidence more seriously.”
Last week, the Dollar broke out. It’s time to take the bear case more seriously.
In clear uptrends like the one we’ve been in, the market is innocent until proven guilty. One or two bearish signals can't keep us on the sidelines. Unfortunately, the bearish signals are adding up.
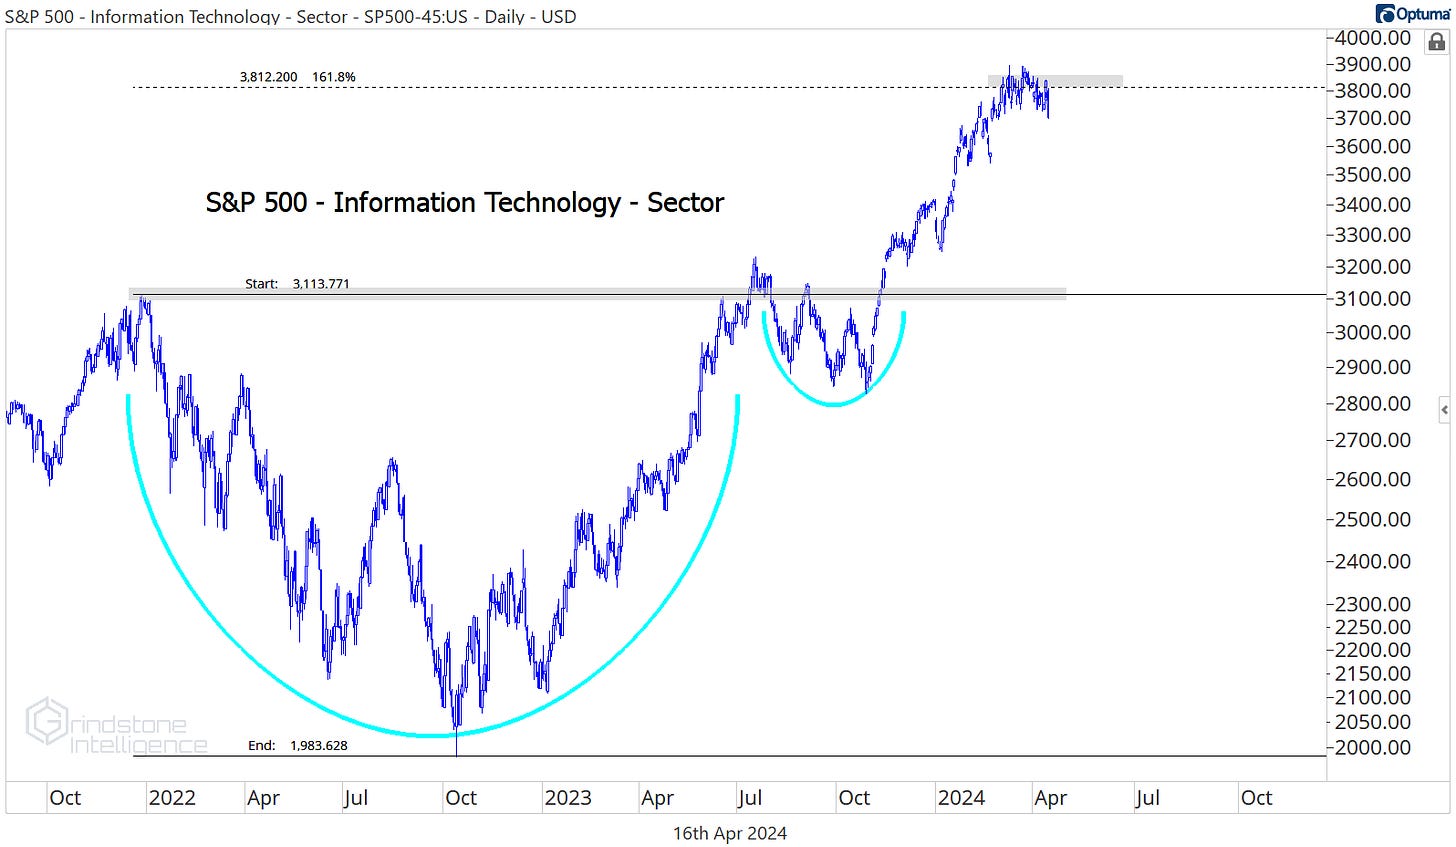
The biggest and most important sector in the index, Information Technology, has been struggling with the 161.8% retracement from the 2022 decline. Yesterday, the sector hit its lowest level in nearly 2 months.
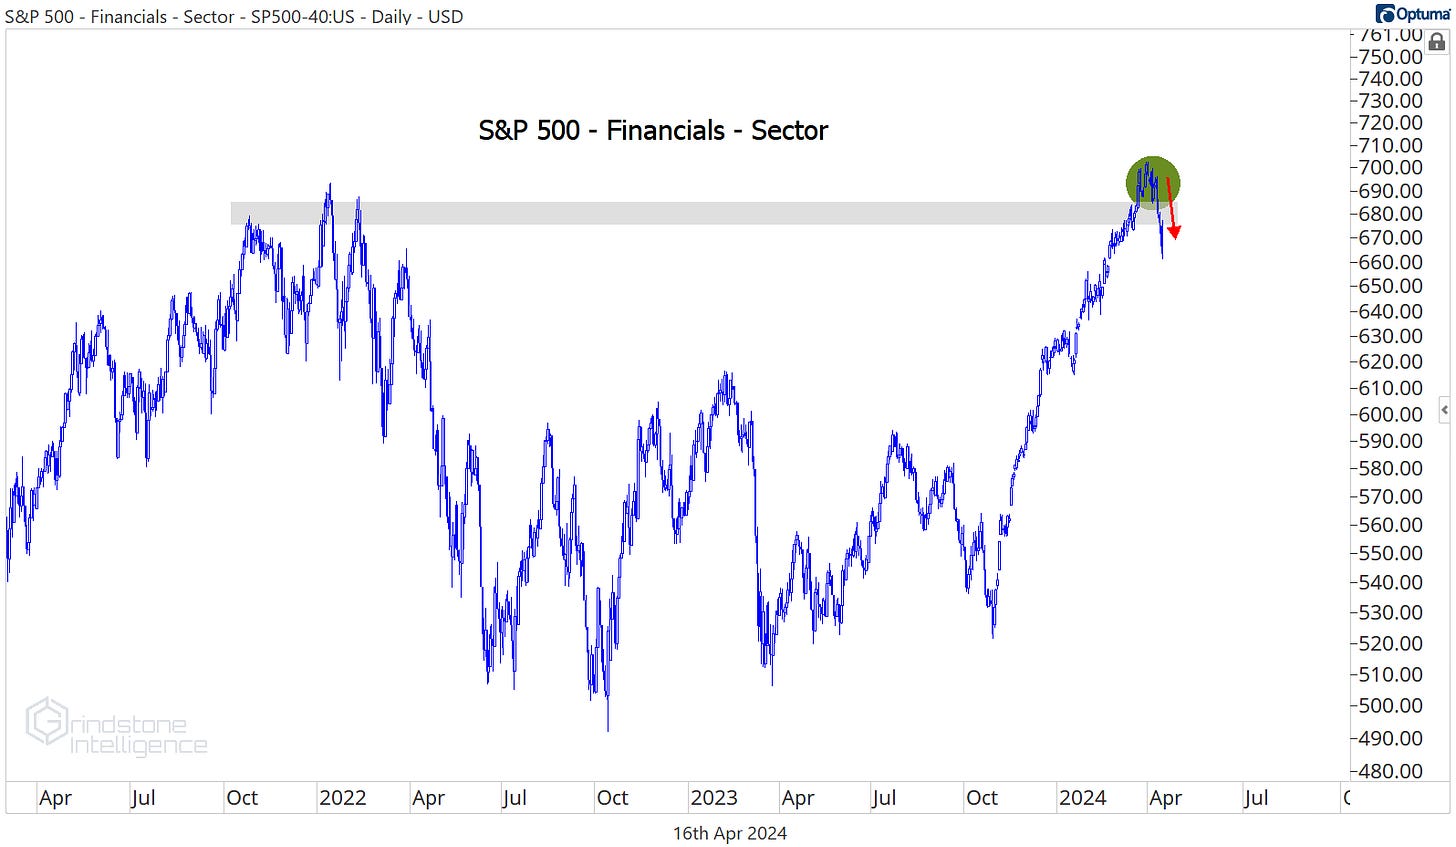
Failing to surpass a logical area of overhead supply isn’t necessarily a problem. It has been our view that Tech stalling out was a symptom of healthy rotation, as other, value-oriented areas of the market stepped in to carry the mantle of the bull market. And for awhile, that’s exactly what we got: The Financials, Materials, Industrials, Health Care, and Energy sectors ALL broke out to new highs.
Then those breakouts started turning into failed moves. The Financials are back below their 2022 highs.
As is Health Care.
And Materials.
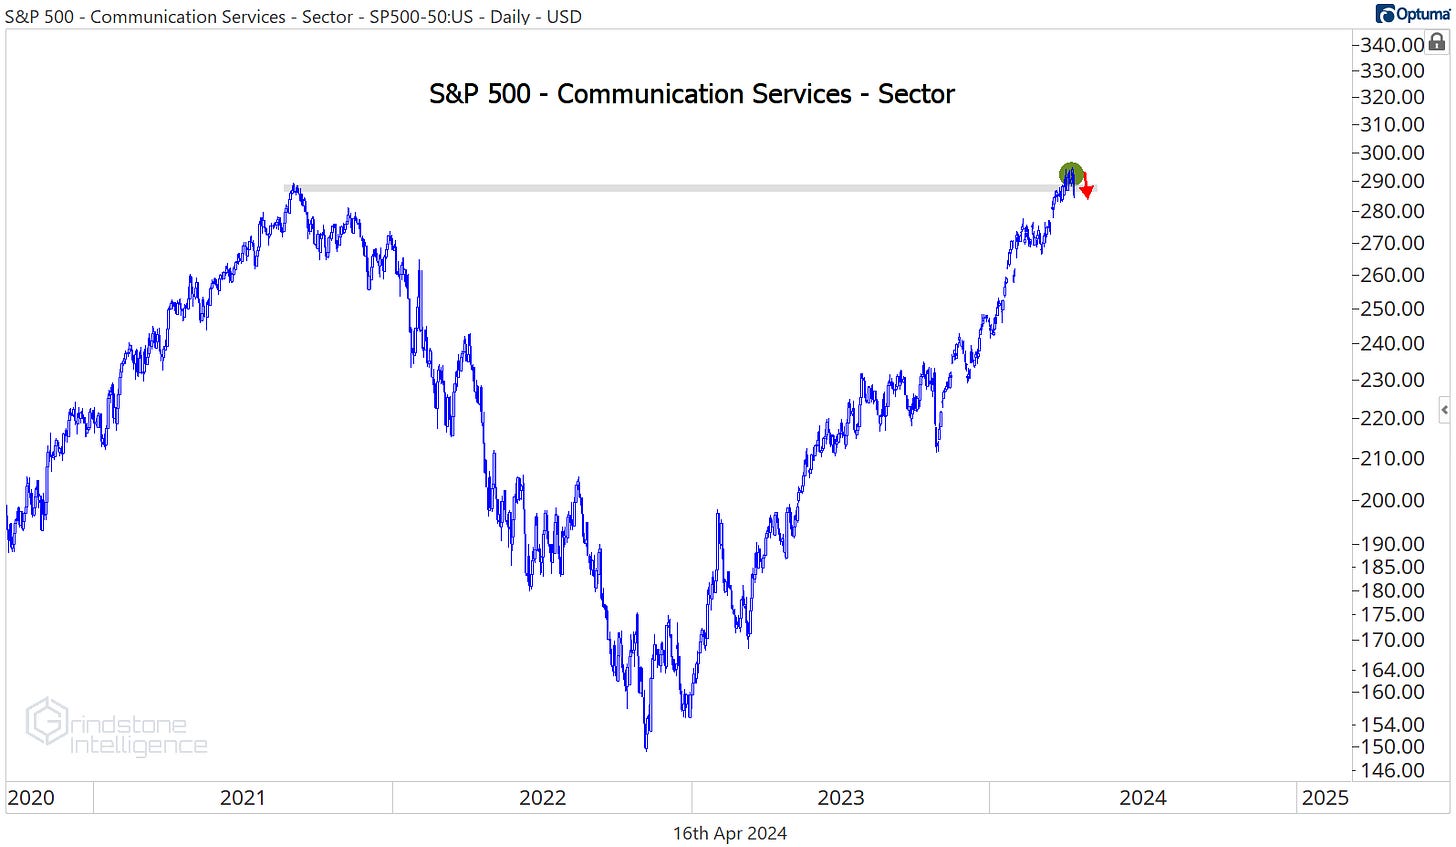
The Communication Services sector just put in a failed breakout, too.
And if we zoom back out to the index level, the Equal Weight S&P 500 Index has the same signature. From failed moves come fast moves in the opposite direction.
It’s pretty clear that this bull market is on hold until further notice - stock prices have topped for now. But was it the top or just a top? For now, we need to continue treating this like a bull market. The majority of stocks in the S&P 500 are above a rising 200-day moving average, and that’s true for more than half of the sectors, too.
Selloffs sparked by failed breakouts are mean reversions until they’ve proven otherwise.
But all new bear markets have to start somewhere.
If we could only watch one thing to tell us that this mean reversion was turning into an outright trend reversal, it would be the list of new lows. You can’t have a bear market without an expansion of that list.
We can look at whether a stock has more recently broken out or broken down and determine whether that stock is in a cycle of setting new highs or new lows. Today, 73% of S&P 500 members are in a new 3-month high cycle, and 79% are in a new 6-month high cycle. When this table starts showing more red than green, we’ll know for sure that the trend has shifted.
In any case, whether this is a mean reversion or the start of something bigger, this isn’t a market where we want to be piling on the risk. We can still look for stocks to buy, but this is not the time to be initiating a bunch of new long positions. Fortunately, we’re not limited to owning just stocks. So what about bonds?
In truth, they’re doing even worse. 30 Year Treasury Bonds are hitting their lowest level of the year after breaking support from the 2022 lows.
But wait, weren’t we all told that interest rates would inevitably revert lower with a less restrictive Federal Reserve? Consensus views have a way of turning out to be wrong. In mid-January, markets were pricing in almost 7 interest rate cuts for 2024. Now they’re looking for less than 2.
Some of that is just the market working to sniff out the impacts of hotter inflation readings and strong economic data that we’ve gotten to start the year. But you can also thank blatant signaling from Fed officials themselves.
One of the most important inputs to the macroeconomic framework is central bank policy. Our lives as analysts would probably be a lot more enjoyable if we didn’t have to check the calendar for FedSpeak every morning, but that’s not the world we live in. As Marty Zweig said so many years ago, don’t fight the Fed.
Some folks out there will point in triumph to last year’s 20% stock market rise while the Federal Reserve continued to hike interest rates and claim that policy doesn’t matter. But that claim is rooted in a misunderstanding of how Fed policies are implemented these days. It’s what the Fed says that matters, not what they do.
It wasn’t always like this. Fed Chairman Alan Greenspan had a reputation for speaking while saying nothing at all. But his successor Ben Bernanke took a different approach. He believed that ‘forward-guidance’ could play an important role in helping to guide market expectations and transmit policy, so his Fed began to give more frequent updates and began publishing the quarterly Summary of Economic Projections, which details Fed officials’ outlooks for the economy.
Today, there are press conferences after every FOMC decision, and it seems there’s a never-ending flow of headlines from FOMC members voicing their opinions. In short, the primary tool of policymakers today is their words.
And the frequency of FedSpeak can be used to identify policy pivots. Check out the number of speaking engagements for officials over the last few years. The spikes are noteworthy.
In the fall of 2020, the Fed had just unveiled their new framework for monetary policy, following several years of review. The new framework detailed an approach called Flexible Average Inflation Targeting (FAIT) which meant that if inflation ran below the Fed’s 2% target for some time, they’d be willing to let inflation run above 2% for some time after that in order to average 2% over the period. Ostensibly, that would allow the Fed to let the labor market run hotter for longer in order to achieve a broad and inclusive definition of full employment. Unsurprisingly, dovish changes in the September 2020 FOMC statement to reflect the new framework for policy required significant clarification and messaging from Fed officials.
The next major spike in FedSpeak was in March and April of 2022, when rate hikes began and the Fed was detailing plans for balance sheet reduction. But a bigger spike in speaking engagements came later that fall with the first Fed pivot: policy tightening stopped ramping in October 2022.
Yes, rate hikes would continue for nearly another year after that point. But those additional hikes were largely just fulfilling forward guidance the Fed had already given. Language around that time stopped focusing on the ‘speed’ of rate hikes and instead began focusing on the end ‘level’ of rates. The very next Summary of Economic Projections after that policy pivot showed a peak policy rate of 5.1% - not far from where rates actually ended up 10 months later.
The latest pivot occurred last fall, when the Fed began shifting away from stable policy in favor of interest rate cuts. To be clear, Fed officials didn’t actually do anything last fall to spark the downturn in rates. They just started talking about doing it.
But now FedSpeak is on the rise again. Chatter is higher today than it’s been at any point over the last 5 years, save the spikes in 2020 and 2023. It seems to us that FOMC members are working overtime to dial back the messaging of rate cuts they began signaling last fall.
All that to say, the trajectory of interest rates doesn’t seem to be pointing lower.
So if bond prices aren’t trending higher and the bull market in equities is on hold, what are we left with? How about what’s going on in the commodities space?
Gold prices continue to rally, closing yesterday at their highest level ever.
And relative to stocks, gold just hit a year-to-date high:
Silver is surging, too. As are copper and crude oil. We covered all that here last week:
Checking in on Commodities
What do we want to own? That’s the question we ask ourselves every day. Is it stocks? Bonds? Commodities? Crypto? Cash? Whether you’re an investor, money manager, or day trader, we all face a similar problem in bull markets: limited capacity. We can’t own every uptrend and compelling story. Instead of just focusing on the
Until next time.


