The Morning Grind - 4/22/2024

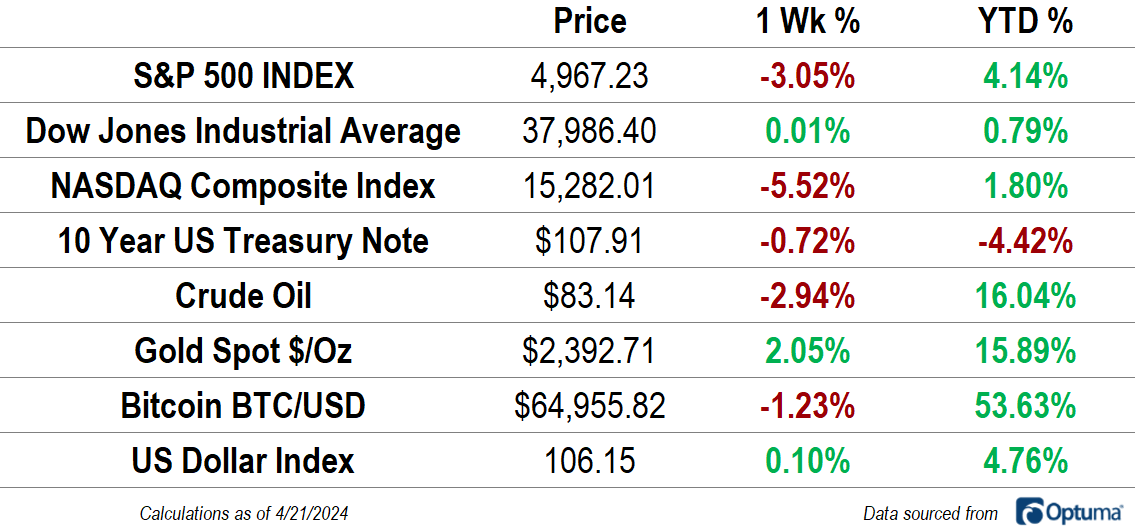
The NASDAQ Composite gave up nearly all of its year-to-date gains and the S&P 500 erased almost half of its own as both indexes fell for the third straight week. The Dow Jones Industrial Average briefly dipped into negative territory for 2024, but rallied back on Friday to (barely) end the week in the green. For the S&P 500, the three week selloff is the largest since December 2022, shortly after the bear market bottom.
The bond market hasn’t been any better: 10-year Treasury note futures have hit the lowest level since November after falling 2.5% in April. Gold, however, continues it be a bright spot. Gold prices have risen 8 of the last 9 weeks and reached another record high on Friday.
Market Internals
Short-term trends have reversed sharply lower over the month of April. Just 20% of S&P 500 stocks are above their 20-day moving average, and one-third are above their 50-day. The weakness is widespread. Just one sector - Utilities - can say that more than half of its constituents are in a short-term uptrend.
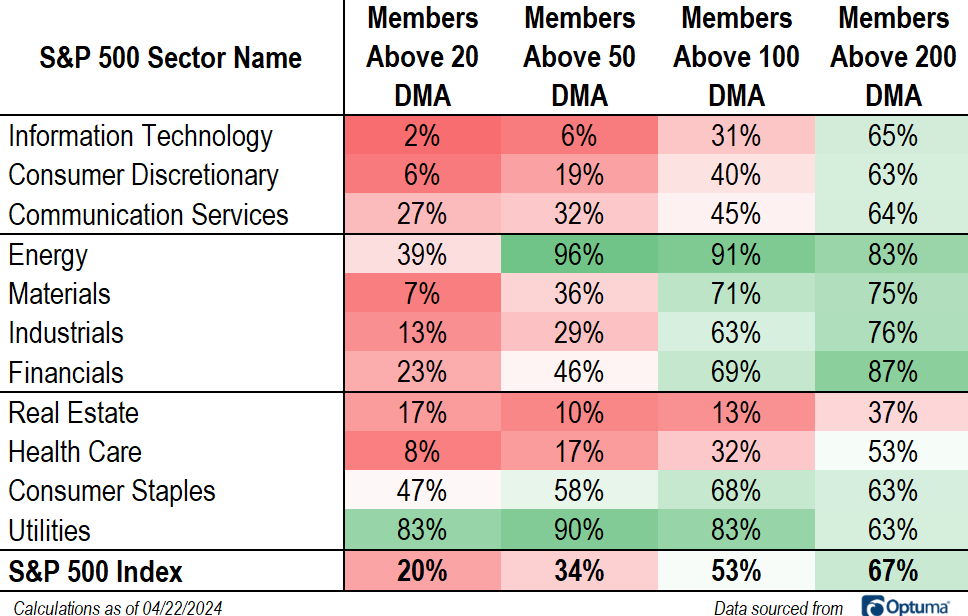
For now, that short-term weakness has yet to do significant damage to the longer-term structure of the market. Two-thirds of stocks in the index are still above their 200-day moving average, and only one sector (Real Estate) has fewer than half of its members in a long-term uptrend. Breadth is strongest in the value-oriented, risk-on sectors: Financials, Energy, Industrials, and Materials.
More from last week:
Weighing Bearish Evidence in a Bull Market

It pays to be an optimist. Stock prices are volatile, everyone knows that. More often than not, though, investors have been rewarded for riding out the waves. Only about half of all trading days end up in the green, yet over the last 100 years or so, 73% of years have yielded positive returns. That’s equated to an average gain of about 10% per year.
Tech Sector Outlook

Yesterday, we detailed the mounting risks to the bull market. The bearish evidence is starting to pile up. The trouble really began in early March, when the biggest and most important sector in the index ran into the 161.8% retracement from the 2022 decline. Momentum was putting in a bearish divergence at the same time, and now Information Technology has gone nowhere for the last 6 weeks as it digests the big gains from the prior 6 months.
Struggling Small Caps

Lag on the way up, lag on the way down. That’s the story of the small caps. During the bear market of 2022, the small caps were the first to stop going down, and for a moment, it looked as though they might be poised to lead on the way back up. Instead, the small caps were entirely absent from the rally for most of 2023, even managing to set new lows last October.
Top Charts from the Communication Services Sector

No sector was worse than Communication Services during the bear market of 2022. From the S&P 500’s peak on January 3, 2022 to its trough in mid-October of that year, the benchmark large cap stock index fell 25%. Over that same period, Communication Services lost a whopping 40% of its value.
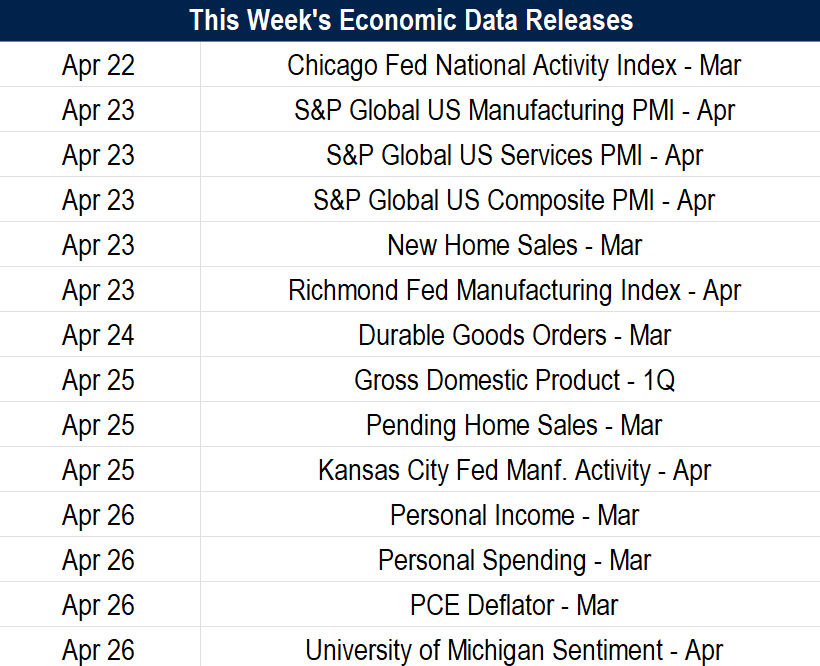
What's Ahead
Here's what to watch in the week ahead: